> ## Documentation Index
> Fetch the complete documentation index at: https://koreai.mintlify.site/llms.txt
> Use this file to discover all available pages before exploring further.
# Create Custom Dashboard
[Back to Analytics Overview](/ai-for-service/analytics/overview)
This page walks through creating a custom dashboard using a Banking AI Agent as an example to analyze performance metrics and identify trends.
## Problem Statement
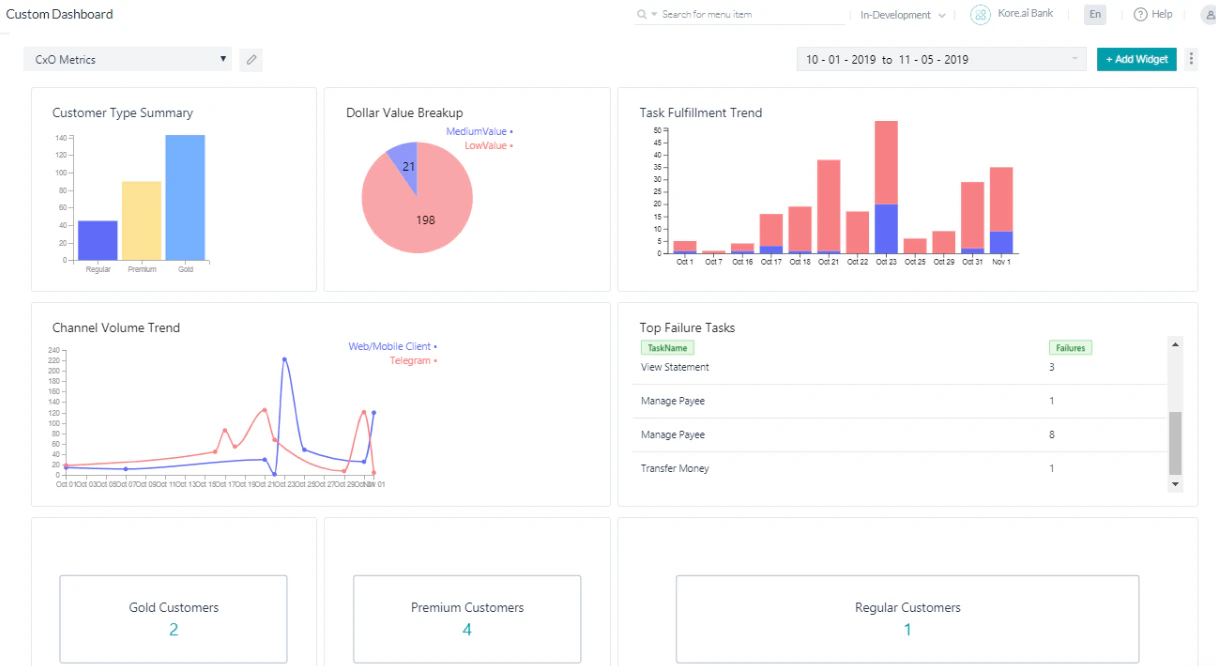
As a Banking AI Agent client, you want to track the following metrics:
* Dollar Value Breakup
* Customer Type Summary
* Task Fulfillment Trend
* Top Failure Tasks
* Channel Volume Trend
* Filter the Messages using the Having clause
Once the dashboard is configured for all scenarios, it looks like the following:
 ***
## Pre-requisites
* AI Agent building knowledge.
* Custom Meta Tags usage. See Custom Meta Tags for more information.
* A Banking AI Agent with the following dialog tasks:
**Transfer Funds**: A dialog task that walks the user through the transfer steps.
***
## Pre-requisites
* AI Agent building knowledge.
* Custom Meta Tags usage. See Custom Meta Tags for more information.
* A Banking AI Agent with the following dialog tasks:
**Transfer Funds**: A dialog task that walks the user through the transfer steps.
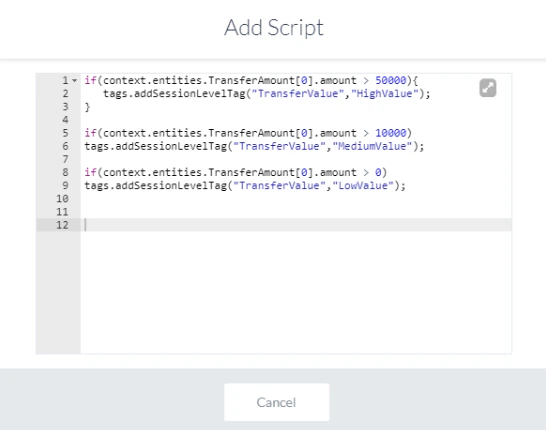
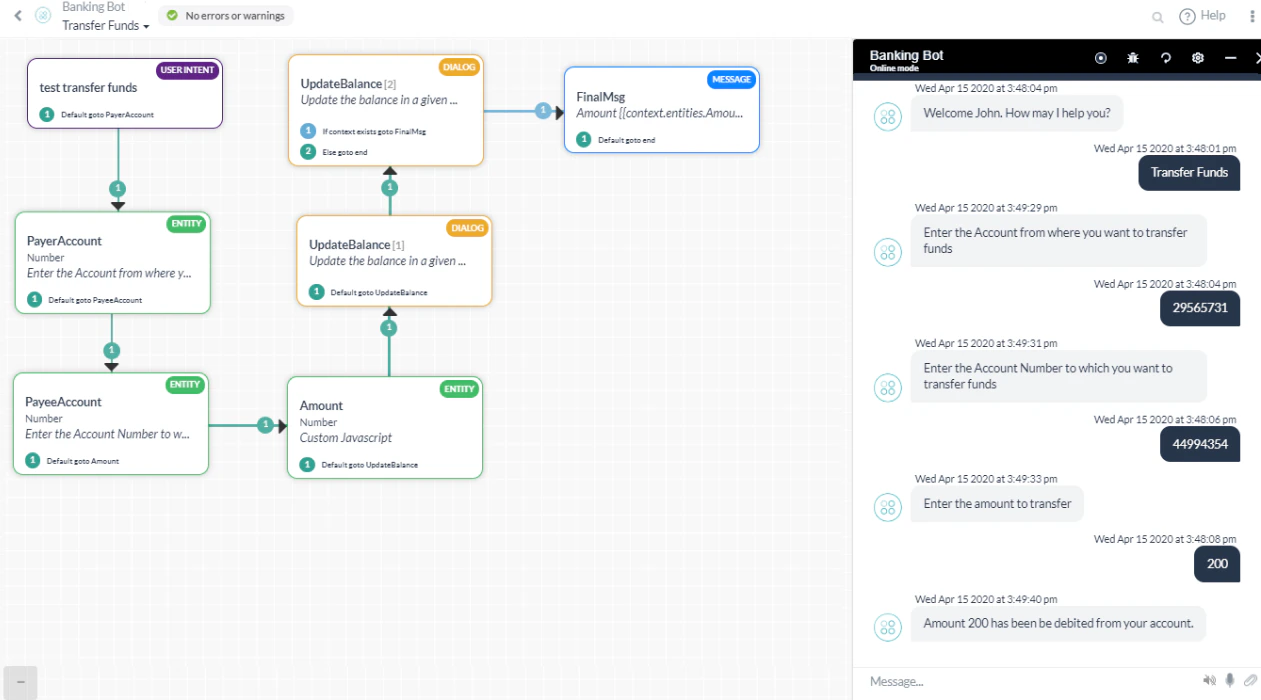 This dialog includes a Script node to add the Custom Meta Tag `TransferValue` based on the amount transferred:
```javascript theme={null}
if(context.entities.TransferAmount[0].amount > 50000){
tags.addSessionLevelTag("TransferValue", "HighValue");
}
if(context.entities.TransferAmount[0].amount > 10000)
tags.addSessionLevelTag("TransferValue","MediumValue");
if(context.entities.TransferAmount[0].amount > 0)
tags.addSessionLevelTag("TransferValue","LowValue");
```
This dialog includes a Script node to add the Custom Meta Tag `TransferValue` based on the amount transferred:
```javascript theme={null}
if(context.entities.TransferAmount[0].amount > 50000){
tags.addSessionLevelTag("TransferValue", "HighValue");
}
if(context.entities.TransferAmount[0].amount > 10000)
tags.addSessionLevelTag("TransferValue","MediumValue");
if(context.entities.TransferAmount[0].amount > 0)
tags.addSessionLevelTag("TransferValue","LowValue");
```
 **Manage Payee**: A dialog task for the user to manage their payee list.
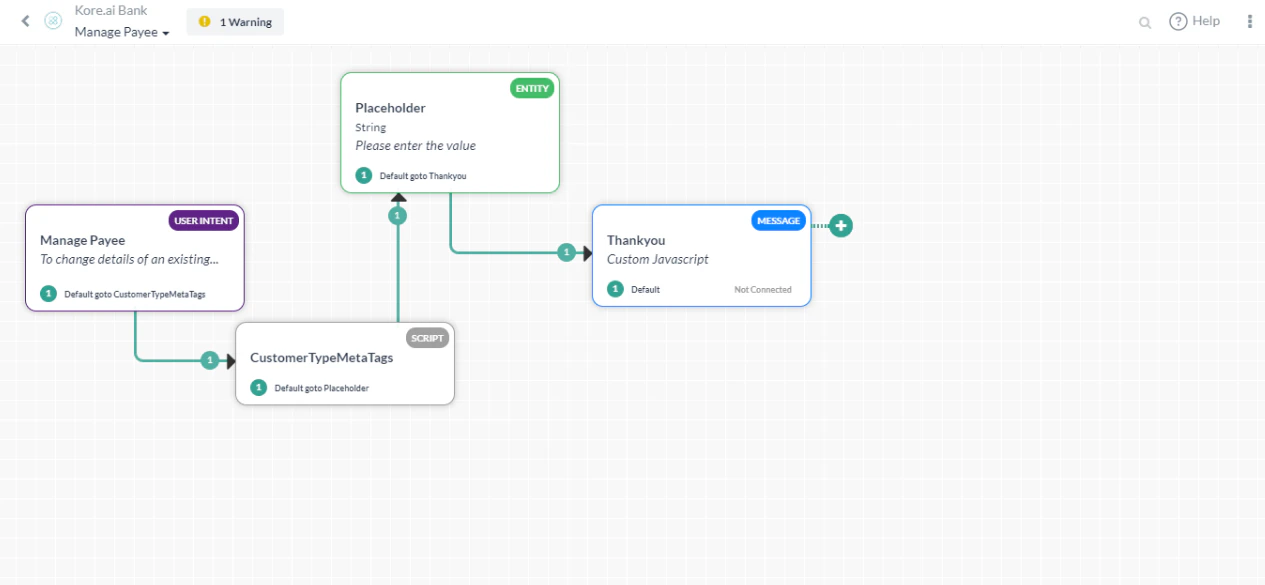 This dialog includes a Script that assigns a value to the `CustomerType` meta tag:
```javascript theme={null}
if(context.custType == 3){
tags.addUserLevelTag("CustomerType","Premium");
}
if(context.custType == 2){
tags.addUserLevelTag("CustomerType","Gold");
};
if(context.custType == 1){
tags.addUserLevelTag("CustomerType","Regular");
};
```
***
## Implementation
1. From the left navigation panel, under **Dashboard**, click **Custom Dashboard**.
2. Click **Create a New Dashboard**.
This dialog includes a Script that assigns a value to the `CustomerType` meta tag:
```javascript theme={null}
if(context.custType == 3){
tags.addUserLevelTag("CustomerType","Premium");
}
if(context.custType == 2){
tags.addUserLevelTag("CustomerType","Gold");
};
if(context.custType == 1){
tags.addUserLevelTag("CustomerType","Regular");
};
```
***
## Implementation
1. From the left navigation panel, under **Dashboard**, click **Custom Dashboard**.
2. Click **Create a New Dashboard**.
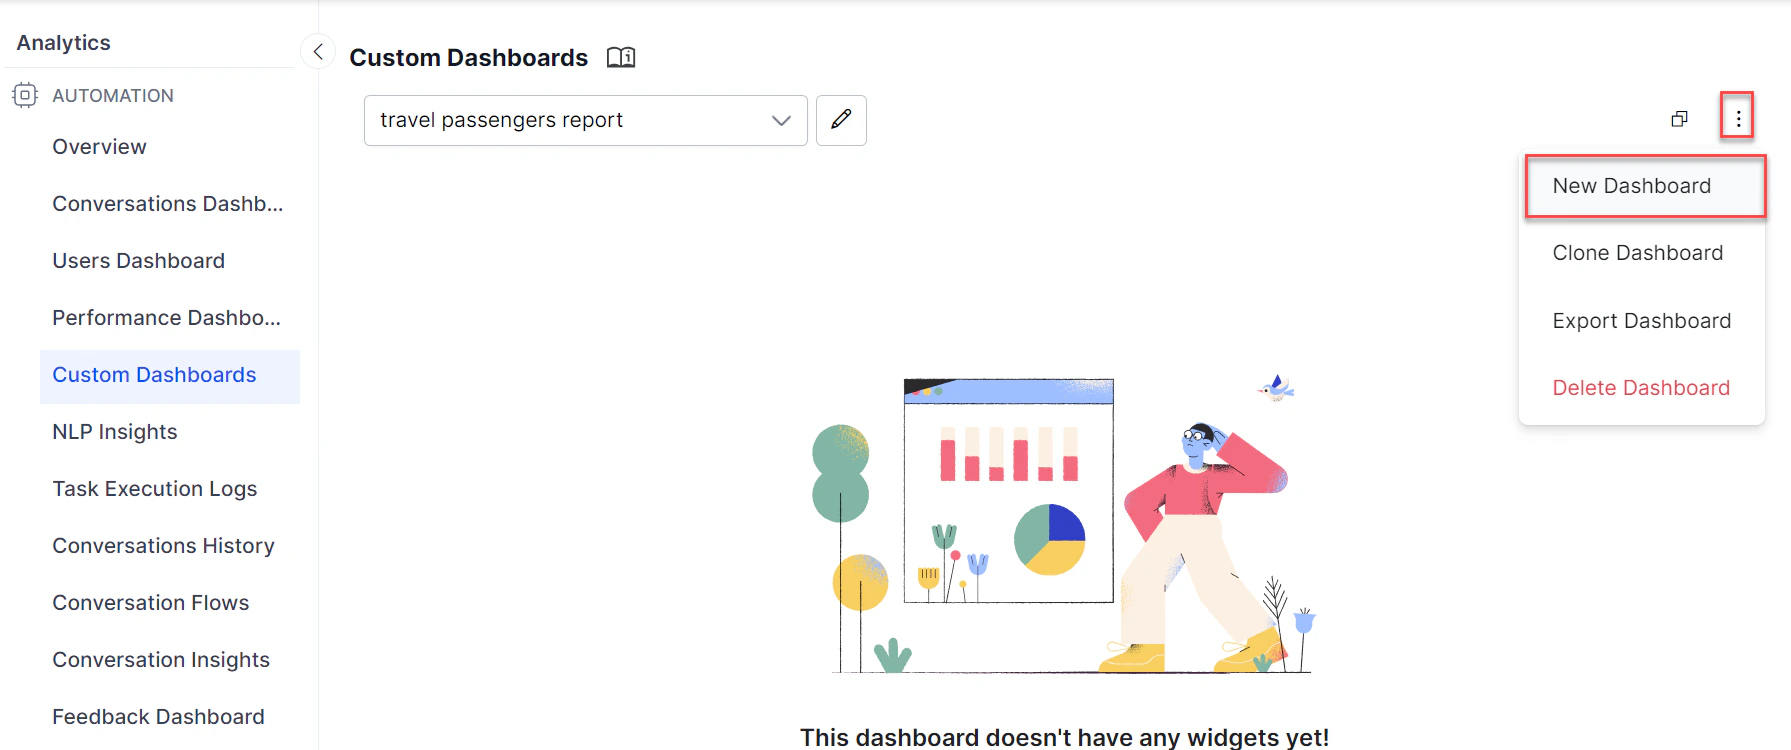 3. Use the **Add Widget** button to add widgets for each scenario. You can add up to 4 widgets per row and organize them by moving within or across rows. Widgets can also be manually resized.
The following sections explain the configuration for each widget.
***
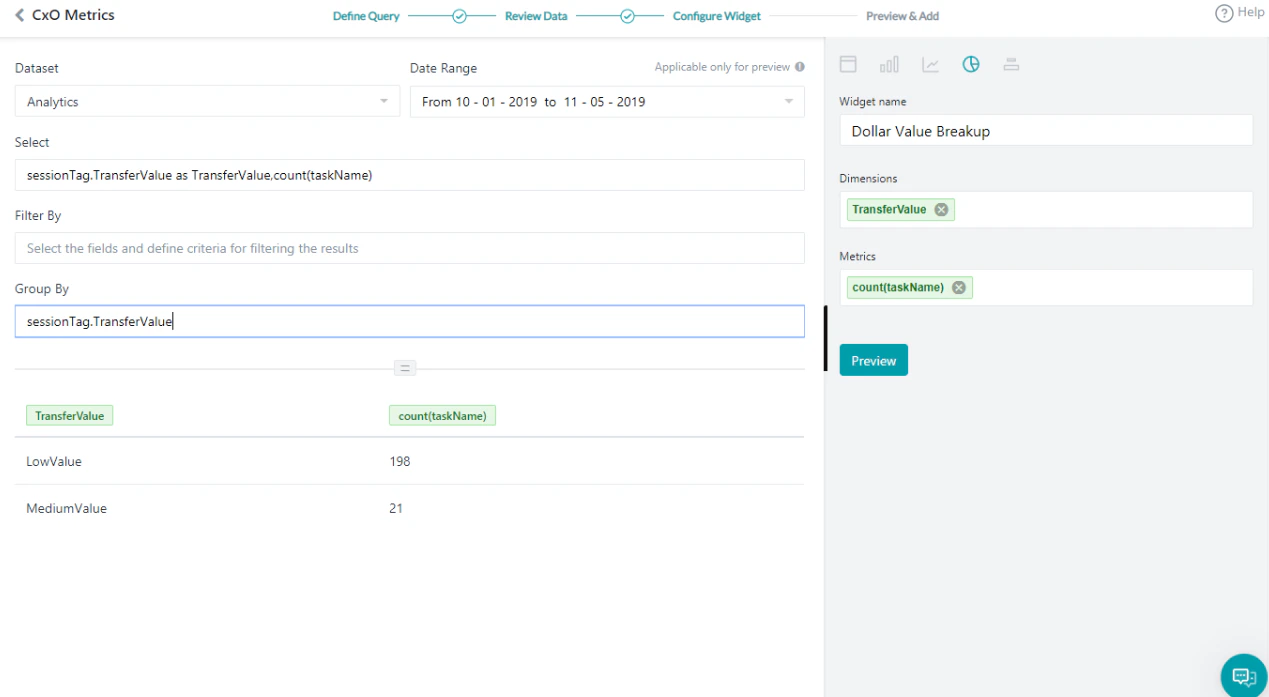
### Dollar Value Breakup
1. Click **Add Widget**.
2. Query setup:
* **Dataset**: Analytics
* **Select**: `sessionTag.TransferValue as TransferValue, count(taskName)`
* **Group By**: `sessionTag.TransferValue`
* Click **Run** to see the results.
3. Widget setup:
* Chart type: **Pie chart**
* **Dimension**: `TransferValue`
* **Metrics**: `count(taskName)`
3. Use the **Add Widget** button to add widgets for each scenario. You can add up to 4 widgets per row and organize them by moving within or across rows. Widgets can also be manually resized.
The following sections explain the configuration for each widget.
***
### Dollar Value Breakup
1. Click **Add Widget**.
2. Query setup:
* **Dataset**: Analytics
* **Select**: `sessionTag.TransferValue as TransferValue, count(taskName)`
* **Group By**: `sessionTag.TransferValue`
* Click **Run** to see the results.
3. Widget setup:
* Chart type: **Pie chart**
* **Dimension**: `TransferValue`
* **Metrics**: `count(taskName)`
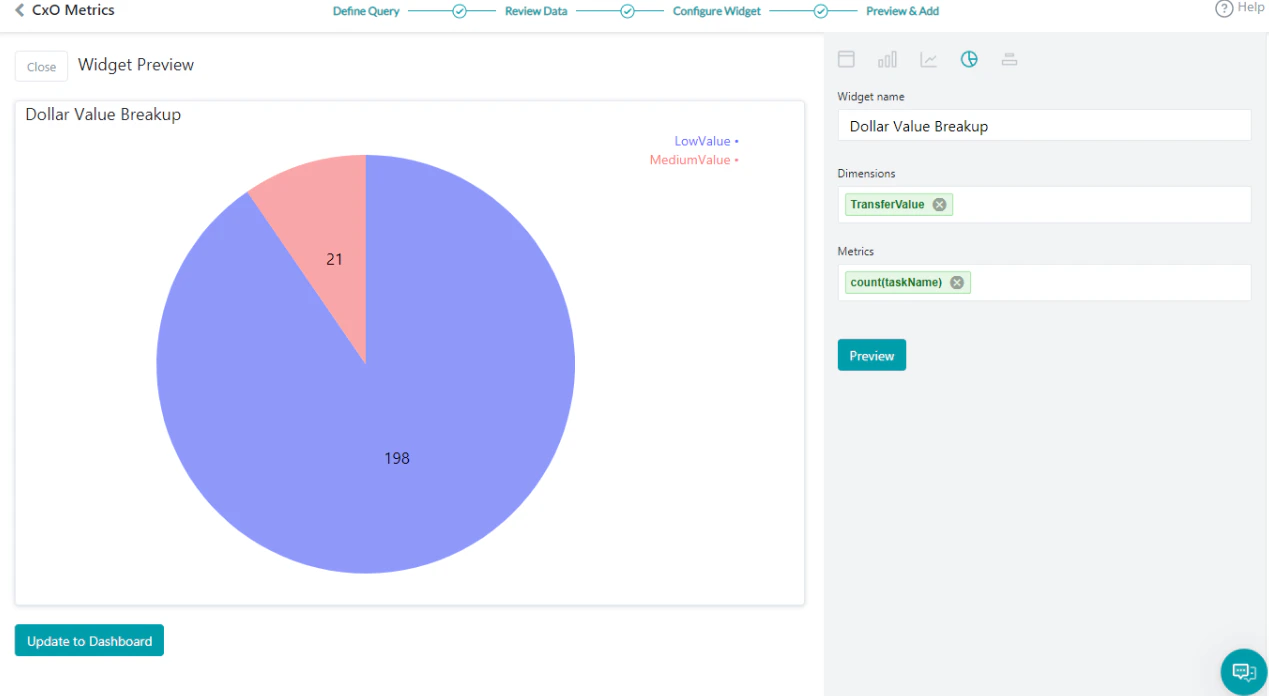
 4. Click **Preview**, then click **Update to Dashboard**.
 ***
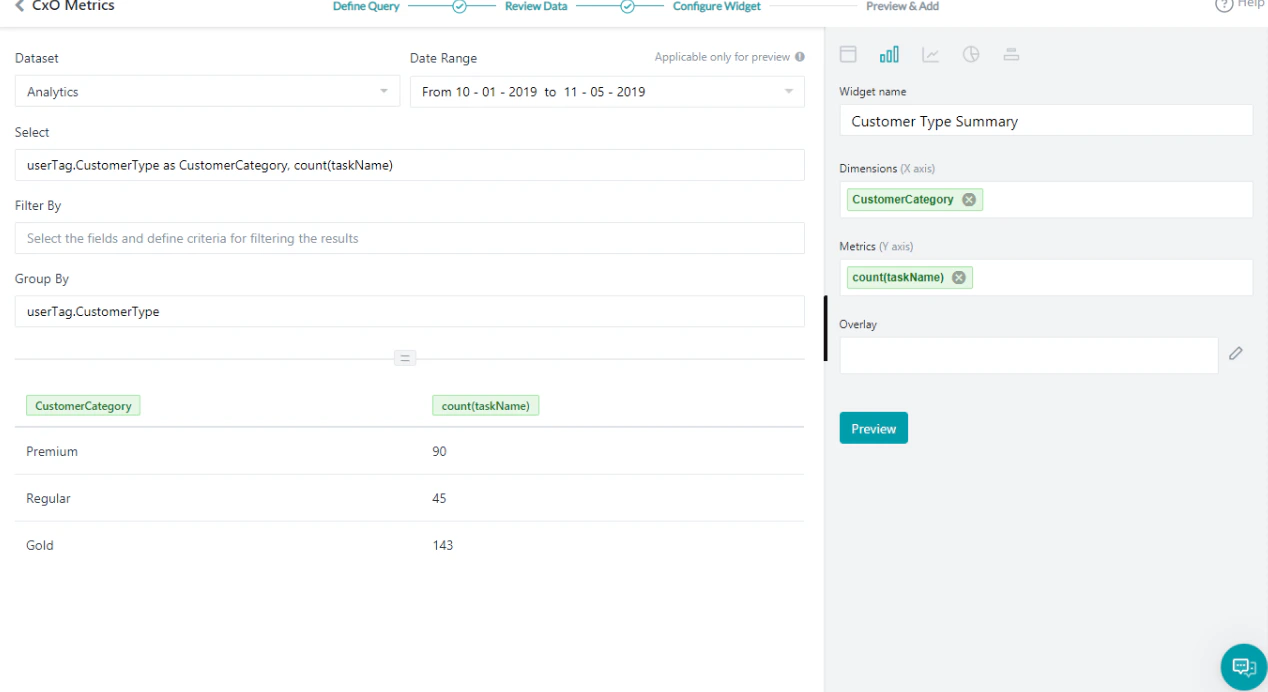
### Customer Type Summary
This query provides usage statistics based on customer type.
1. Click **Add Widget**.
2. Query setup:
* **Dataset**: Analytics
* **Select**: `userTag.CustomerType as CustomerCategory, count(taskName)`
* **Group By**: `userTag.CustomerType`
* Click **Run** to see the results.
3. Widget setup:
* Chart type: **Bar chart**
* **Dimension**: `CustomerCategory`
* **Metrics**: `count(taskName)`
***
### Customer Type Summary
This query provides usage statistics based on customer type.
1. Click **Add Widget**.
2. Query setup:
* **Dataset**: Analytics
* **Select**: `userTag.CustomerType as CustomerCategory, count(taskName)`
* **Group By**: `userTag.CustomerType`
* Click **Run** to see the results.
3. Widget setup:
* Chart type: **Bar chart**
* **Dimension**: `CustomerCategory`
* **Metrics**: `count(taskName)`
 4. Click **Preview**, then click **Update to Dashboard**.
***
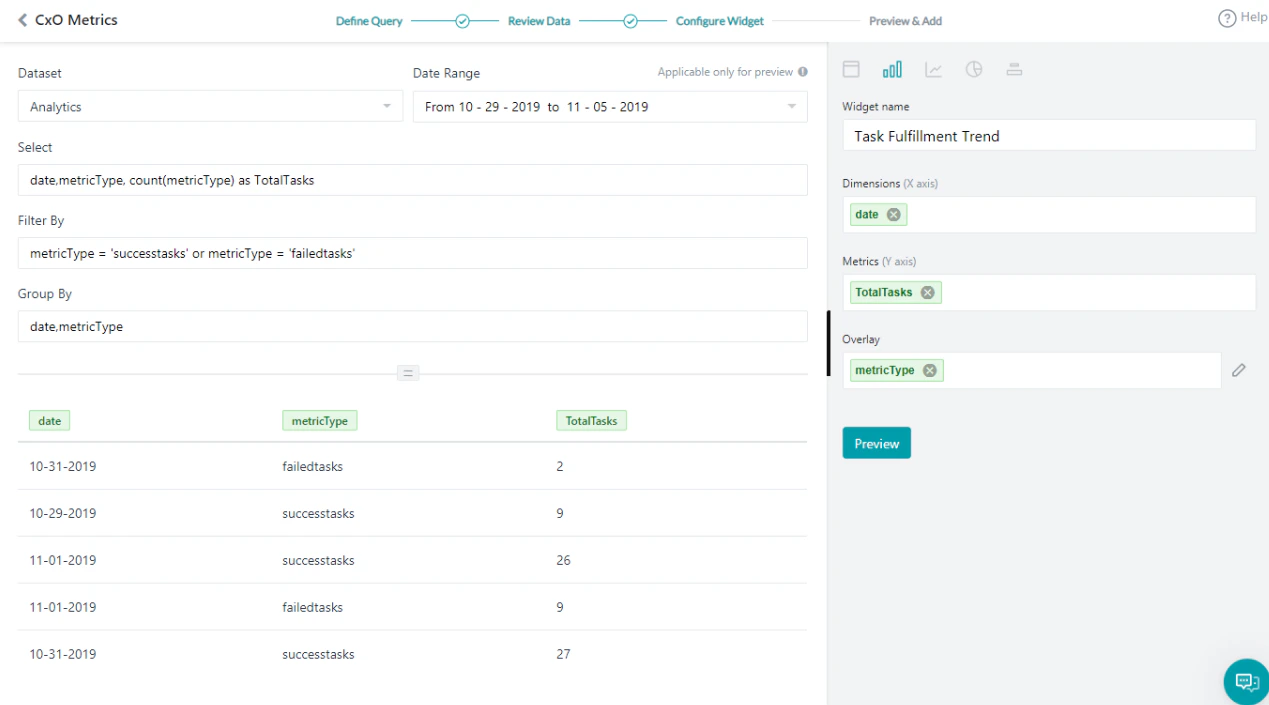
### Task Fulfillment Trend
This query provides day-wise task success vs. failure trends.
1. Click **Add Widget**.
2. Query setup:
* **Dataset**: Analytics
* **Select**: `date, metricType, count(metricType) as TotalTasks`
* **Filter By**: `metricType = 'successtasks' or metricType = 'failedtasks'`
* **Group By**: `date, metricType`
* Click **Run** to see the results.
3. Widget setup:
* Chart type: **Bar chart**
* **Dimension**: `date`
* **Metrics**: `TotalTasks`
* **Overlay**: `metricType`
4. Click **Preview**, then click **Update to Dashboard**.
***
### Task Fulfillment Trend
This query provides day-wise task success vs. failure trends.
1. Click **Add Widget**.
2. Query setup:
* **Dataset**: Analytics
* **Select**: `date, metricType, count(metricType) as TotalTasks`
* **Filter By**: `metricType = 'successtasks' or metricType = 'failedtasks'`
* **Group By**: `date, metricType`
* Click **Run** to see the results.
3. Widget setup:
* Chart type: **Bar chart**
* **Dimension**: `date`
* **Metrics**: `TotalTasks`
* **Overlay**: `metricType`
 4. Click **Preview**, then click **Update to Dashboard**.
***
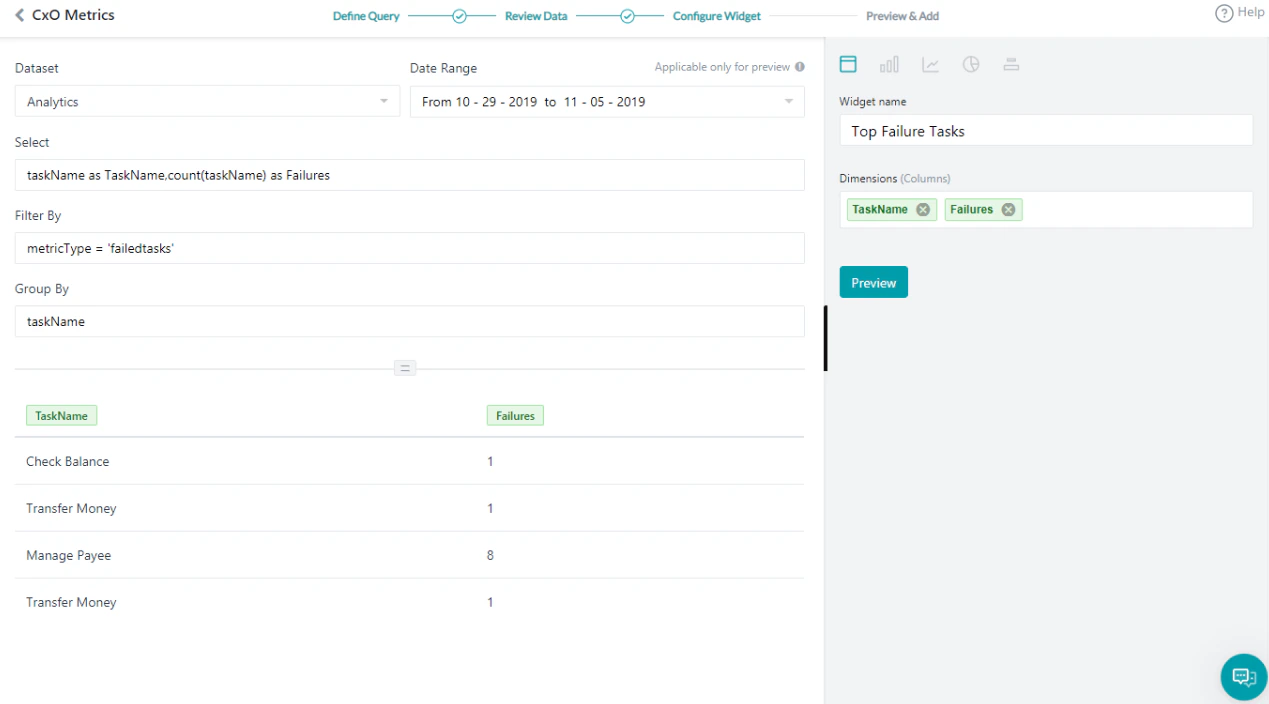
### Top Failure Tasks
This query shows the top tasks that are failing.
1. Click **Add Widget**.
2. Query setup:
* **Dataset**: Analytics
* **Select**: `taskName as TaskName, count(taskName) as Failures`
* **Filter By**: `metricType = 'failedtasks'`
* **Group By**: `taskName`
* Click **Run** to see the results.
3. Widget setup:
* Chart type: **Table chart**
* **Dimension**: `TaskName` and `Failures`
4. Click **Preview**, then click **Update to Dashboard**.
***
### Top Failure Tasks
This query shows the top tasks that are failing.
1. Click **Add Widget**.
2. Query setup:
* **Dataset**: Analytics
* **Select**: `taskName as TaskName, count(taskName) as Failures`
* **Filter By**: `metricType = 'failedtasks'`
* **Group By**: `taskName`
* Click **Run** to see the results.
3. Widget setup:
* Chart type: **Table chart**
* **Dimension**: `TaskName` and `Failures`
 4. Click **Preview**, then click **Update to Dashboard**.
***
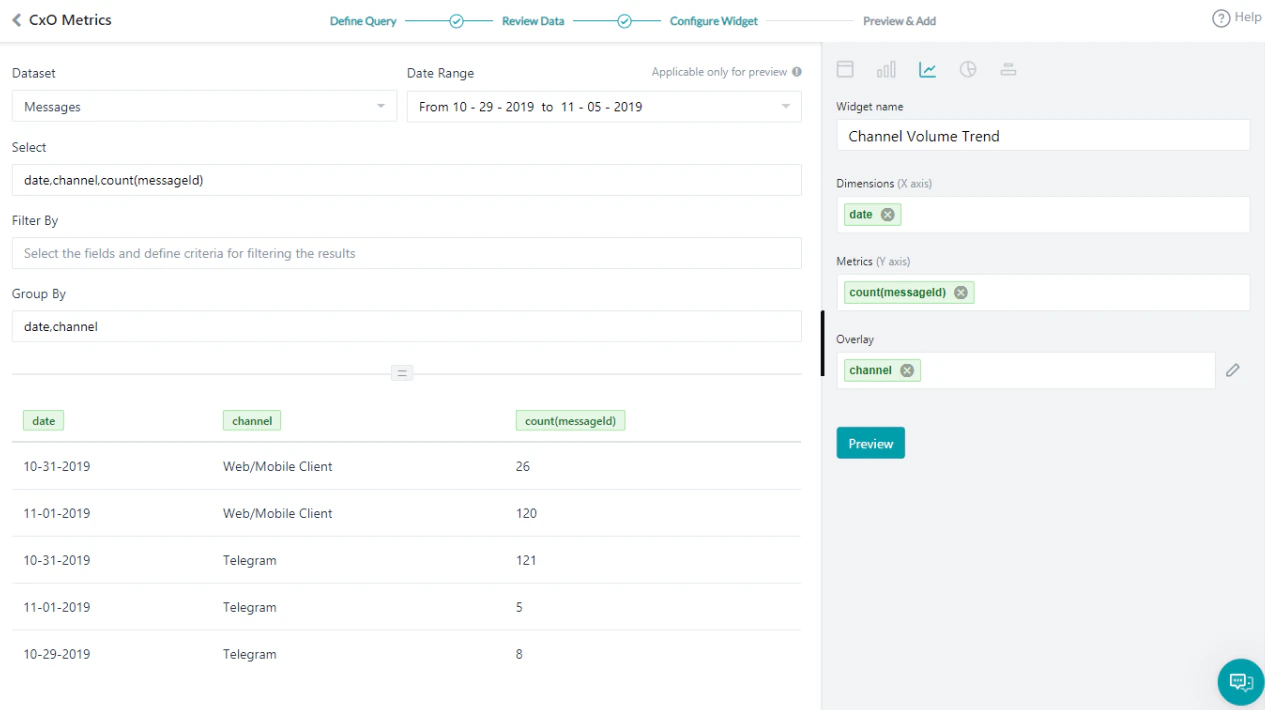
### Channel Volume Trend
This query provides channel-wise usage details.
1. Click **Add Widget**.
2. Query setup:
* **Dataset**: Messages
* **Select**: `date, channel, count(messageId)`
* **Group By**: `date, channel`
* Click **Run** to see the results.
3. Widget setup:
* Chart type: **Line chart**
* **Dimension**: `date`
* **Metrics**: `count(messageId)`
* **Overlay**: `channel`
4. Click **Preview**, then click **Update to Dashboard**.
***
### Channel Volume Trend
This query provides channel-wise usage details.
1. Click **Add Widget**.
2. Query setup:
* **Dataset**: Messages
* **Select**: `date, channel, count(messageId)`
* **Group By**: `date, channel`
* Click **Run** to see the results.
3. Widget setup:
* Chart type: **Line chart**
* **Dimension**: `date`
* **Metrics**: `count(messageId)`
* **Overlay**: `channel`
 4. Click **Preview**, then click **Update to Dashboard**.
Your custom dashboard is ready. Set the **Date Range** to view the required metrics for each scenario.
***
### Filter the Messages using the Having Clause
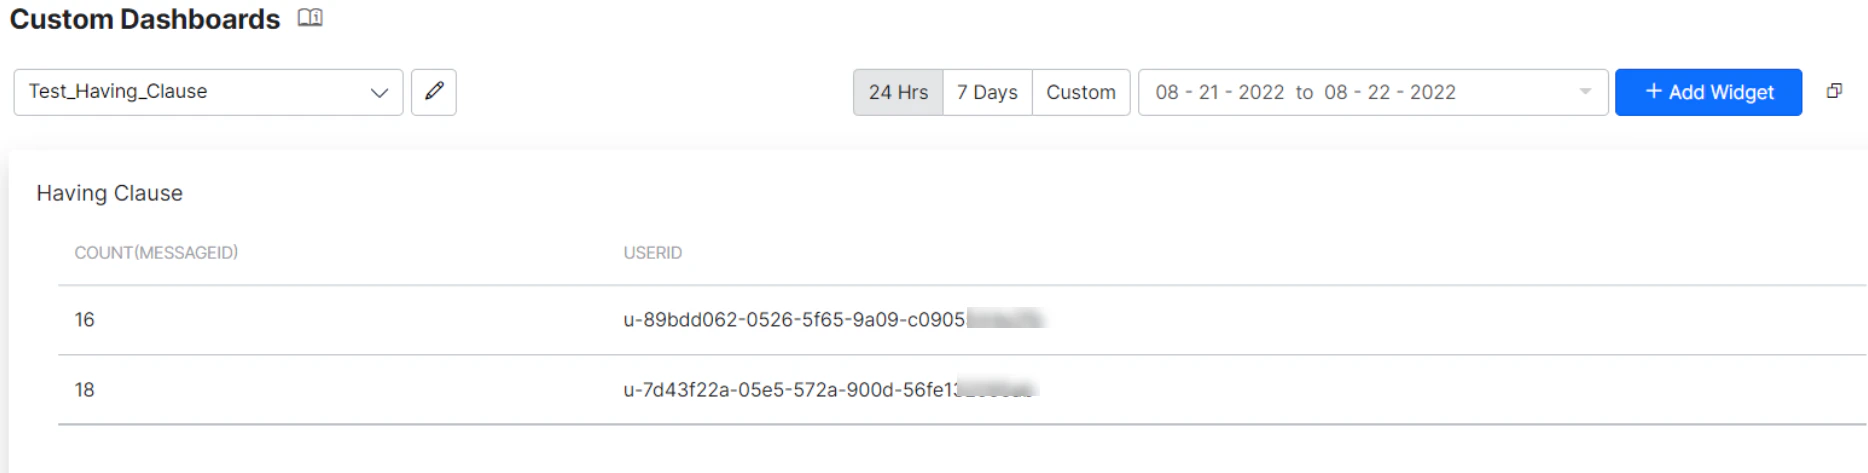
This query uses a **Having** clause to display the number of messages per userId where the user has interacted with the AI Agent more than 12 times.
1. Click **Add Widget**.
2. Query setup:
* **Dataset**: Messages
* **Select**: `count(messageId), userId`
* **Group By**: `userId`
* **Having**: `count(messageId) > 12`
* Click **Run** to see the results.
3. Widget setup:
* Chart type: **Table chart**
* **Dimension**: `count(messageId)`, `userId`
4. The following shows results when retrieving the count of all messages grouped by userId (without the Having clause):
4. Click **Preview**, then click **Update to Dashboard**.
Your custom dashboard is ready. Set the **Date Range** to view the required metrics for each scenario.
***
### Filter the Messages using the Having Clause
This query uses a **Having** clause to display the number of messages per userId where the user has interacted with the AI Agent more than 12 times.
1. Click **Add Widget**.
2. Query setup:
* **Dataset**: Messages
* **Select**: `count(messageId), userId`
* **Group By**: `userId`
* **Having**: `count(messageId) > 12`
* Click **Run** to see the results.
3. Widget setup:
* Chart type: **Table chart**
* **Dimension**: `count(messageId)`, `userId`
4. The following shows results when retrieving the count of all messages grouped by userId (without the Having clause):
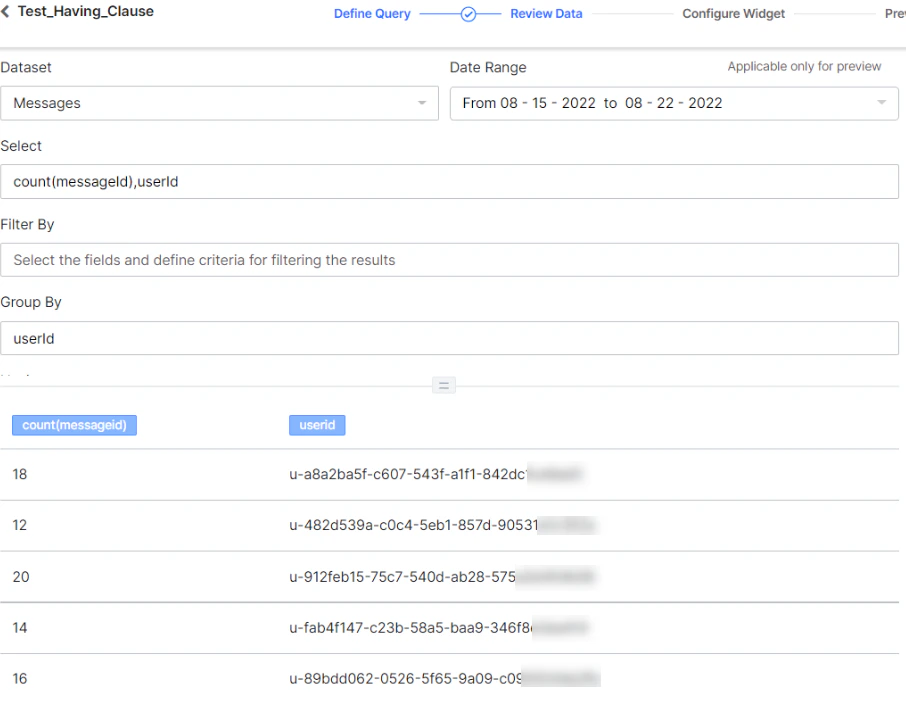 5. The following shows results when using the Having clause (only users with more than 12 messages):
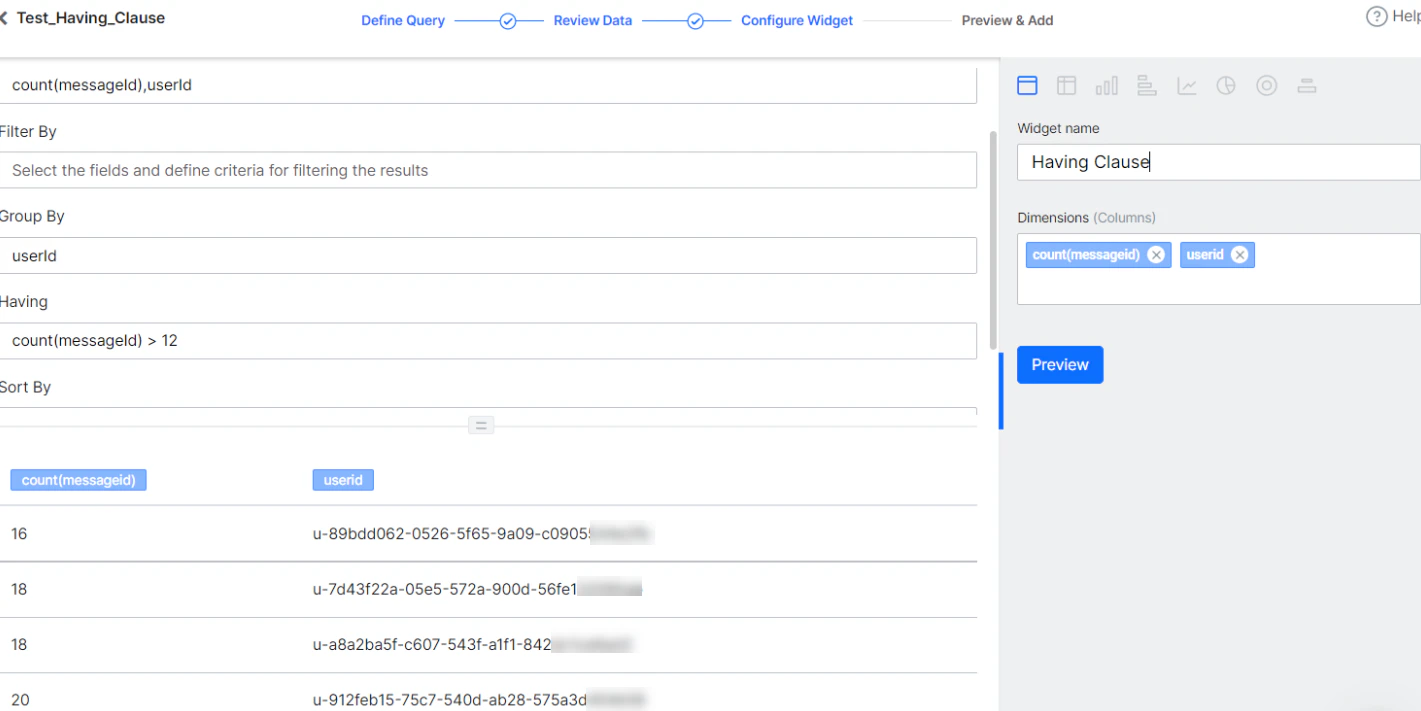 6. Click **Preview**, then click **Add to Dashboard**.
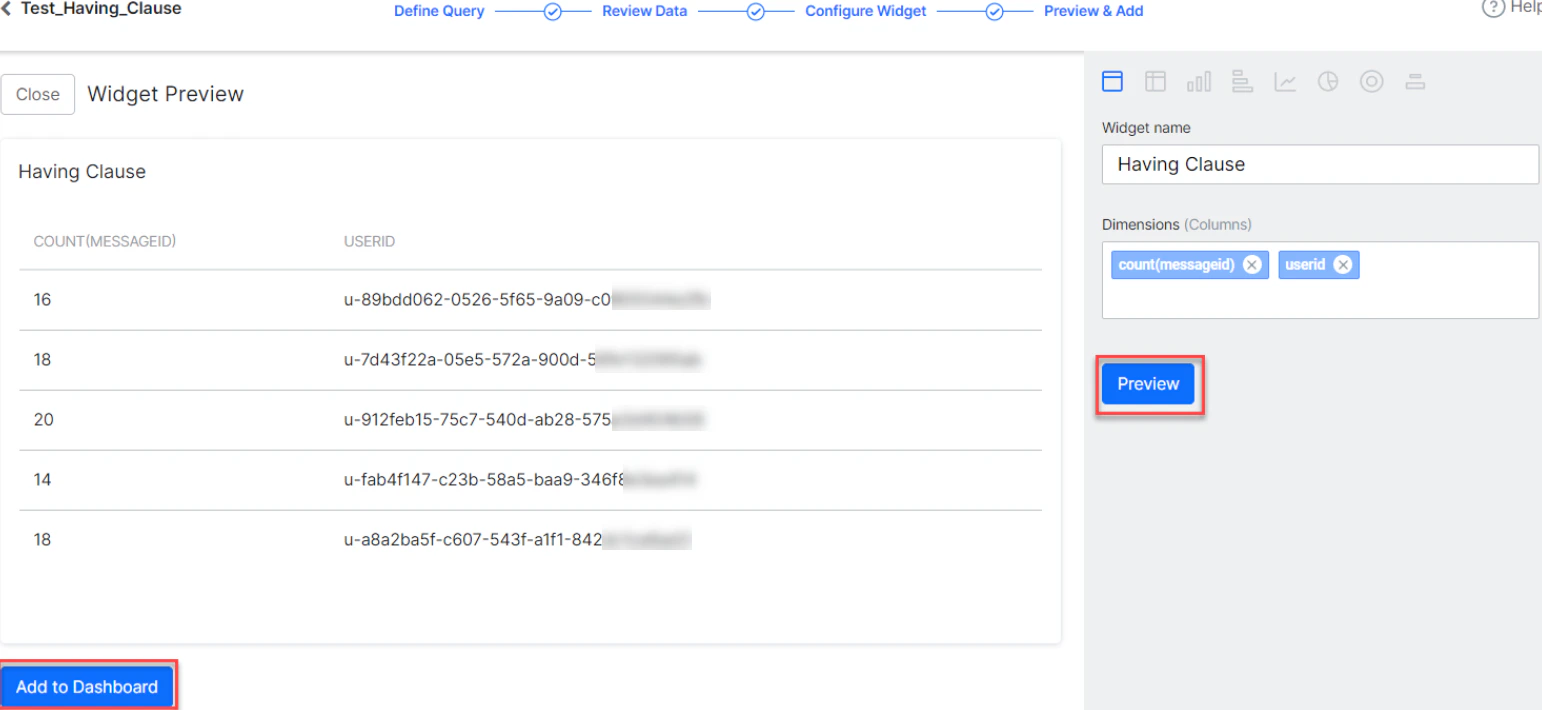 7. The Having clause widget is added to the dashboard: