> ## Documentation Index
> Fetch the complete documentation index at: https://koreai.mintlify.app/llms.txt
> Use this file to discover all available pages before exploring further.
# Supervisor Dashboard
The Supervisor Dashboard (QA Dashboard) provides real-time insights into audit results, agent performance, and failure statistics across daily, weekly, and monthly timeframes. By default, it displays daily reports for all categories.
**Key features:**
| Feature | Description |
| ------------------------------------------- | -------------------------------------------------------------- |
| **Adherence Heatmap & Performance Monitor** | Track evaluation scores, coaching activity, and trends. |
| **Agent Leaderboard** | Rank agents by performance. |
| **Scorecard Trends** | Display average scores at global and language-specific levels. |
| **Critical Metrics** | Highlight poor performance using negatively weighted scores. |
| **Flagged Interactions** | Surface interactions needing coaching across all tools. |
To access the Dashboard, enable **Auto QA** and set up an evaluation form in **Settings**. Only users with appropriate permissions can access QA functionality.
Navigate to **Quality AI** > **ANALYZE** > **Dashboard**.
 ***
## Dashboard Filters
### Language Filter
Filter metrics by one or more languages simultaneously. Language options are based on languages configured at the evaluation metric level under **Configuration** > **Settings** > **Language Settings**.
To filter by language:
1. Select the **All Languages** filter at the top of the dashboard.
2. Select one or more languages from the dropdown.
3. Metrics update automatically to show language-specific data.
***
## Dashboard Filters
### Language Filter
Filter metrics by one or more languages simultaneously. Language options are based on languages configured at the evaluation metric level under **Configuration** > **Settings** > **Language Settings**.
To filter by language:
1. Select the **All Languages** filter at the top of the dashboard.
2. Select one or more languages from the dropdown.
3. Metrics update automatically to show language-specific data.
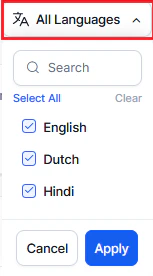 By default, all languages are selected. Metrics appear only for languages configured at the evaluation metric level.
When a language filter is applied, the following widgets update:
| Widget | Update |
| ------------------------- | ---------------------------------------------- |
| **Total Audits** | Shows audit count for selected languages only. |
| **Avg. Audits per Agent** | Shows average for selected languages. |
| **Evaluation Score** | Updates Manual and Auto QA scores. |
| **Fail Statistics** | Shows failure data for selected languages. |
| **Performance Monitor** | Updates performance metrics. |
### Date Range Filter
Select a date range from the **Calendar** dropdown in the top-right corner.
1. Select the **Calendar** dropdown.
2. Select the desired date range.
3. Select **Apply**.
By default, all languages are selected. Metrics appear only for languages configured at the evaluation metric level.
When a language filter is applied, the following widgets update:
| Widget | Update |
| ------------------------- | ---------------------------------------------- |
| **Total Audits** | Shows audit count for selected languages only. |
| **Avg. Audits per Agent** | Shows average for selected languages. |
| **Evaluation Score** | Updates Manual and Auto QA scores. |
| **Fail Statistics** | Shows failure data for selected languages. |
| **Performance Monitor** | Updates performance metrics. |
### Date Range Filter
Select a date range from the **Calendar** dropdown in the top-right corner.
1. Select the **Calendar** dropdown.
2. Select the desired date range.
3. Select **Apply**.
 ### Channel Filter
Filter by **Voice**, **Chat**, or **All** (includes both). The dashboard presents trends in daily, weekly, and monthly views, along with a distribution view.
To filter by channel:
1. Select **All Channels** in the top-right corner.
2. Choose **Voice**, **Chat**, or **All**.
### Channel Filter
Filter by **Voice**, **Chat**, or **All** (includes both). The dashboard presents trends in daily, weekly, and monthly views, along with a distribution view.
To filter by channel:
1. Select **All Channels** in the top-right corner.
2. Choose **Voice**, **Chat**, or **All**.
 ***
## Agent Performance Metrics
Metrics are filtered based on the selected languages and date range.
### Total Audits
Number of completed manual audits.
***
## Agent Performance Metrics
Metrics are filtered based on the selected languages and date range.
### Total Audits
Number of completed manual audits.
 ### Avg. Audits per Agent
Average number of manual audits completed by each agent in their assigned queues.
### Avg. Audits per Agent
Average number of manual audits completed by each agent in their assigned queues.
 ### Coaching Sessions Assigned
Total coaching sessions assigned to agents by supervisors.
### Coaching Sessions Assigned
Total coaching sessions assigned to agents by supervisors.
 ### Agents in Coaching
Number of agents with an active coaching assignment in queues accessible to the supervisor.
### Agents in Coaching
Number of agents with an active coaching assignment in queues accessible to the supervisor.
 ### Fatal Interactions
Number of interactions that failed due to critical errors. If an interaction meets any fatal criteria in the evaluation form, the entire scorecard scores zero.
### Fatal Interactions
Number of interactions that failed due to critical errors. If an interaction meets any fatal criteria in the evaluation form, the entire scorecard scores zero.
 ### Audit Progress
Tracks overall audit progress (completed and pending).
| Status | Description |
| ------------- | ------------------------------------------------ |
| **Completed** | Number of assigned interactions audited. |
| **Pending** | Number of assigned interactions not yet audited. |
Select **Audit** to navigate to **Conversation Mining** > **Audit Allocations** to start evaluating. For more information, see [Audit Allocations](../analyze/conversation-mining-audit-allocations.md).
### Audit Progress
Tracks overall audit progress (completed and pending).
| Status | Description |
| ------------- | ------------------------------------------------ |
| **Completed** | Number of assigned interactions audited. |
| **Pending** | Number of assigned interactions not yet audited. |
Select **Audit** to navigate to **Conversation Mining** > **Audit Allocations** to start evaluating. For more information, see [Audit Allocations](../analyze/conversation-mining-audit-allocations.md).
 ### Evaluation Score
Displays the trend of the average Kore Evaluation Score (Auto QA) and average Audit Score (manual) over the last 7 days, 7 weeks, or 7 months.
### Evaluation Score
Displays the trend of the average Kore Evaluation Score (Auto QA) and average Audit Score (manual) over the last 7 days, 7 weeks, or 7 months.
 ***
## Adherence Heatmap
Shows a simplified heatmap of adherence data for the past 7 days, with a default form selection and no option for detailed drill-down.
You can filter by evaluation form and flag fatal interactions. You can also set a default evaluation form using **Mark as Default** to view related data on both the heatmap and QA Dashboard.
***
## Adherence Heatmap
Shows a simplified heatmap of adherence data for the past 7 days, with a default form selection and no option for detailed drill-down.
You can filter by evaluation form and flag fatal interactions. You can also set a default evaluation form using **Mark as Default** to view related data on both the heatmap and QA Dashboard.
 | Option | Description |
| ------------------- | ------------------------------------------------------------------------------------------------------------------------------- |
| **Evaluation Form** | Choose a form to set as Default; related data including fatal interactions appear on the heatmap and QA Dashboard. |
| **Language Filter** | Use the All Languages dropdown to filter by language; all languages selected by default. |
| **Tooltip** | Hover over the heatmap to see adherence percentage, interaction count, and total interactions for the selected agents and date. |
Enable **Auto QA** under **Settings** > **Quality AI General Settings** to configure evaluation forms and generate automated scores.
Select **View More Details** to see detailed adherence trends. For more information, see [Adherence Heatmap](../analyze/adherence-heatmap.md).
***
## Fail Statistics
Provides detailed insights into failed interactions — helping supervisors monitor performance and identify improvement areas.
Use Fail Statistics to:
* Track failed interaction percentages by evaluation form, agent scorecard, date range, and language.
* Analyze fatal interaction percentages in daily, weekly, or monthly format.
* Visualize failure rates through interactive charts.
### Evaluation Form
Shows failure rates across selected evaluation forms, highlighting negative scores for critical metrics. Hover over the chart to see detailed failure rates and negatively weighted scores per metric.
The system assigns negative weights to critical metrics within evaluation forms. These produce negative final scores for interactions that fail key criteria.
| Option | Description |
| ------------------- | ------------------------------------------------------------------------------------------------------------------------------- |
| **Evaluation Form** | Choose a form to set as Default; related data including fatal interactions appear on the heatmap and QA Dashboard. |
| **Language Filter** | Use the All Languages dropdown to filter by language; all languages selected by default. |
| **Tooltip** | Hover over the heatmap to see adherence percentage, interaction count, and total interactions for the selected agents and date. |
Enable **Auto QA** under **Settings** > **Quality AI General Settings** to configure evaluation forms and generate automated scores.
Select **View More Details** to see detailed adherence trends. For more information, see [Adherence Heatmap](../analyze/adherence-heatmap.md).
***
## Fail Statistics
Provides detailed insights into failed interactions — helping supervisors monitor performance and identify improvement areas.
Use Fail Statistics to:
* Track failed interaction percentages by evaluation form, agent scorecard, date range, and language.
* Analyze fatal interaction percentages in daily, weekly, or monthly format.
* Visualize failure rates through interactive charts.
### Evaluation Form
Shows failure rates across selected evaluation forms, highlighting negative scores for critical metrics. Hover over the chart to see detailed failure rates and negatively weighted scores per metric.
The system assigns negative weights to critical metrics within evaluation forms. These produce negative final scores for interactions that fail key criteria.
 ### Agent Scorecard
Shows the trend of failed interactions as a percentage based on selected scorecard metrics. If any metric is fatal, the system assigns a zero score to the entire interaction or scorecard.
### Agent Scorecard
Shows the trend of failed interactions as a percentage based on selected scorecard metrics. If any metric is fatal, the system assigns a zero score to the entire interaction or scorecard.
 The **Agent Scorecard** tab appears only when the widget is enabled in [Quality AI General Settings](../configure/quality-ai-general-settings.md).
***
## Performance Monitor
Displays overall performance scores for the selected language, date range, and evaluation form with negative weights.
### Evaluation Form
| View | Description |
| ---------------- | ------------------------------------------------------------------------------------------------------------------------------------------------------- |
| **Trends** | Visualizes average Kore Evaluation scores (positive and negative) from agent scorecards on a daily, weekly, and monthly basis. |
| **Distribution** | Groups agents across evaluation score bands in increments of 10 (for example, 0–10, 11–20) and shows the percentage in each band for 7, 30, or 90 days. |
The **Agent Scorecard** tab appears only when the widget is enabled in [Quality AI General Settings](../configure/quality-ai-general-settings.md).
***
## Performance Monitor
Displays overall performance scores for the selected language, date range, and evaluation form with negative weights.
### Evaluation Form
| View | Description |
| ---------------- | ------------------------------------------------------------------------------------------------------------------------------------------------------- |
| **Trends** | Visualizes average Kore Evaluation scores (positive and negative) from agent scorecards on a daily, weekly, and monthly basis. |
| **Distribution** | Groups agents across evaluation score bands in increments of 10 (for example, 0–10, 11–20) and shows the percentage in each band for 7, 30, or 90 days. |

 ### Agent Scorecard
| View | Description |
| ---------------- | --------------------------------------------------------------------------------------------------- |
| **Trends** | Shows the percentage of interactions with agent scorecard failures based on the selected scorecard. |
| **Distribution** | Groups agents across scorecard score bands in increments of 10 for 7, 30, or 90 days. |
### Agent Scorecard
| View | Description |
| ---------------- | --------------------------------------------------------------------------------------------------- |
| **Trends** | Shows the percentage of interactions with agent scorecard failures based on the selected scorecard. |
| **Distribution** | Groups agents across scorecard score bands in increments of 10 for 7, 30, or 90 days. |

 Enable the **Agent Scorecard** toggle in **Quality AI General Settings** to access this feature.
***
## Agent Leaderboard
A centralized view for identifying top and bottom performers. This widget works independently of language selection and channel filters.
Enable the **Agent Scorecard** toggle under **Quality AI General Settings** to activate automated scoring. If disabled, the leaderboard shows no data.
### Leaderboard Columns
| Column | Description |
| ------------------------- | ---------------------------------------------- |
| **Agents** | Agent group name and assigned queue. |
| **Audit Completed** | Total manual audits completed by each agent. |
| **Audit Score** | Average score of manual audits. |
| **Kore Evaluation Score** | Average Auto QA score per audited interaction. |
| **Fail Percentage** | Failure percentage across all interactions. |
Select **View Leaderboard** to see top and bottom performers in detail.
Enable the **Agent Scorecard** toggle in **Quality AI General Settings** to access this feature.
***
## Agent Leaderboard
A centralized view for identifying top and bottom performers. This widget works independently of language selection and channel filters.
Enable the **Agent Scorecard** toggle under **Quality AI General Settings** to activate automated scoring. If disabled, the leaderboard shows no data.
### Leaderboard Columns
| Column | Description |
| ------------------------- | ---------------------------------------------- |
| **Agents** | Agent group name and assigned queue. |
| **Audit Completed** | Total manual audits completed by each agent. |
| **Audit Score** | Average score of manual audits. |
| **Kore Evaluation Score** | Average Auto QA score per audited interaction. |
| **Fail Percentage** | Failure percentage across all interactions. |
Select **View Leaderboard** to see top and bottom performers in detail.
 ### Access Agent Leaderboard
You can access the full leaderboard from two places:
* Navigate to **Quality AI** > **Dashboard** > **Agent Leaderboard**.
### Access Agent Leaderboard
You can access the full leaderboard from two places:
* Navigate to **Quality AI** > **Dashboard** > **Agent Leaderboard**.
 * Navigate to **Quality AI** > **Agent Leaderboard**.
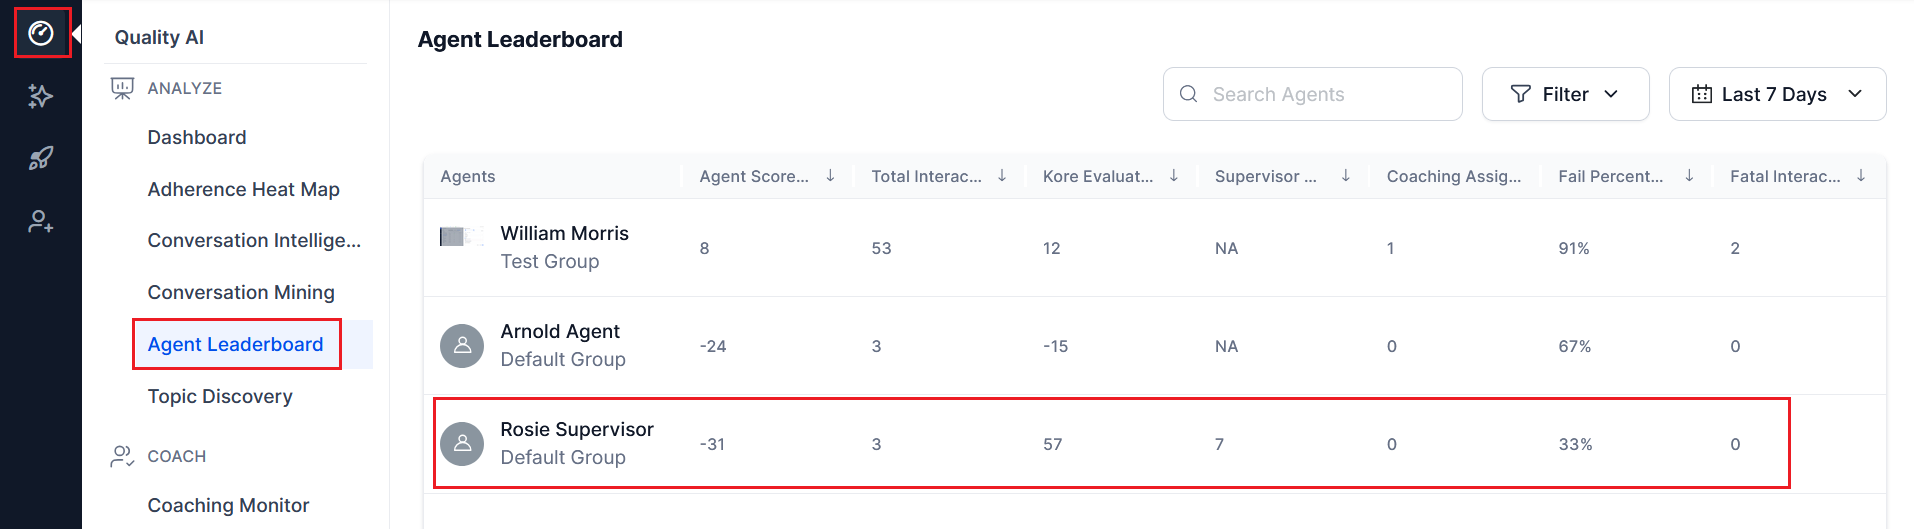 Select any agent to view their individual dashboard.
 * If no scorecards are assigned to an agent, the supervisor cannot view that agent's scorecard details. For more information, see [Supervisor View with Agent-Specific Dashboard](supervisor-view-agent-specific-dashboard.md).
* Supervisors can review language-specific interactions and evaluation details to support targeted coaching.
* Bookmarked interactions help assign relevant coaching tasks, with the most recent interactions shown first.
For more information, see [Supervisor View with Agent-Specific Dashboard](../analyze/supervisor-view-agent-specific-dashboard.md) and [My Dashboard - Agent View](../analyze/my-dashboard-agent-view.md).
***
Built with [Mintlify](https://mintlify.com).
* If no scorecards are assigned to an agent, the supervisor cannot view that agent's scorecard details. For more information, see [Supervisor View with Agent-Specific Dashboard](supervisor-view-agent-specific-dashboard.md).
* Supervisors can review language-specific interactions and evaluation details to support targeted coaching.
* Bookmarked interactions help assign relevant coaching tasks, with the most recent interactions shown first.
For more information, see [Supervisor View with Agent-Specific Dashboard](../analyze/supervisor-view-agent-specific-dashboard.md) and [My Dashboard - Agent View](../analyze/my-dashboard-agent-view.md).
***
Built with [Mintlify](https://mintlify.com).