> ## Documentation Index
> Fetch the complete documentation index at: https://koreai.mintlify.app/llms.txt
> Use this file to discover all available pages before exploring further.
# My Dashboard - Agent View
My Dashboard is a personalized workspace where agents view their own performance. It shows supervisor-assigned scorecards and key insights — such as sentiment trends and resolution effectiveness — based on their conversations.
Agents can monitor performance trends, identify coaching opportunities, and track improvement areas using Calendar and Channel filters.
A supervisor or administrator must enable the following settings before the dashboard loads personalized data:
* **Auto QA**
* **Agent Score Card**
* **Agent Access to Scored Interactions**
Find these under **Configure** > **Settings** > **Quality AI General Settings**.
Navigate to **Quality AI** > **ANALYZE** > **My Dashboard**.
 ***
## Filters
### Language Filter
Filter metrics by one or more languages. Metrics adjust to show only data for the selected language.
Language options are based on the evaluation metric level configuration under **Configure** > **Settings** > **Language Settings**.
1. Select the **All Languages** filter.
2. Select one or more languages from the dropdown.
***
## Filters
### Language Filter
Filter metrics by one or more languages. Metrics adjust to show only data for the selected language.
Language options are based on the evaluation metric level configuration under **Configure** > **Settings** > **Language Settings**.
1. Select the **All Languages** filter.
2. Select one or more languages from the dropdown.
 By default, all languages are selected. Metrics appear only for languages configured at the evaluation metric level.
When a language filter is applied, the following widgets update:
| Widget | Update |
| ------------------------- | ---------------------------------------------- |
| **Total Audits** | Shows audit count for selected languages only. |
| **Avg. Audits per Agent** | Shows average for selected languages. |
| **Evaluation Score** | Updates Manual and Auto QA scores. |
| **Fail Statistics** | Shows failure data for selected languages. |
| **Performance Monitor** | Updates performance metrics. |
### Date Range Filter
Select a time period using the calendar to analyze and compare performance data.
### Channel Filter
Filter by Voice, Chat, or both. Metrics update based on the selected channel and language.
1. Select **All Channels**.
2. Choose **Voice**, **Chat**, or both.
***
## Agent Performance Metrics
Key indicators of performance and coaching progress, filtered by language and date range.
| Metric | Description |
| ------------------------------ | ----------------------------------------------------------------- |
| **Total Interactions** | Total interactions during the selected period. |
| **Kore Evaluation Score** | Average automated evaluation score for completed calls. |
| **No. of Supervisor Audits** | Total manually audited interactions completed by supervisors. |
| **Supervisor Audit Score** | Average score from manual supervisor audits. |
| **Total Coaching Assignments** | Number of coaching sessions assigned during the selected period. |
| **No. of Fails** | Total number of failed scorecards during the selected period. |
| **Fatal Interactions** | Interactions that failed critical compliance or quality criteria. |
***
## Coaching Insights
Highlights strengths and areas for improvement based on selected scorecards.
### Scorecard Selection
1. Open the **Select Scorecard** dropdown.
2. Choose one or more scorecards.
3. Insights update automatically.
| Display | Description |
| ------------------------ | ------------------------------------------------------------------------------------------------------------------- |
| **Strongest Attributes** | Top 5 attributes scoring 80 or higher, ordered by performance. Use to identify and leverage peak performance areas. |
| **Opportunity Areas** | Bottom 5 attributes scoring below 80, prioritized by lowest scores. Use to focus coaching and training efforts. |
Both lists update in real-time when scorecards change. A scroll option appears when more than 5 attributes exist.
By default, all languages are selected. Metrics appear only for languages configured at the evaluation metric level.
When a language filter is applied, the following widgets update:
| Widget | Update |
| ------------------------- | ---------------------------------------------- |
| **Total Audits** | Shows audit count for selected languages only. |
| **Avg. Audits per Agent** | Shows average for selected languages. |
| **Evaluation Score** | Updates Manual and Auto QA scores. |
| **Fail Statistics** | Shows failure data for selected languages. |
| **Performance Monitor** | Updates performance metrics. |
### Date Range Filter
Select a time period using the calendar to analyze and compare performance data.
### Channel Filter
Filter by Voice, Chat, or both. Metrics update based on the selected channel and language.
1. Select **All Channels**.
2. Choose **Voice**, **Chat**, or both.
***
## Agent Performance Metrics
Key indicators of performance and coaching progress, filtered by language and date range.
| Metric | Description |
| ------------------------------ | ----------------------------------------------------------------- |
| **Total Interactions** | Total interactions during the selected period. |
| **Kore Evaluation Score** | Average automated evaluation score for completed calls. |
| **No. of Supervisor Audits** | Total manually audited interactions completed by supervisors. |
| **Supervisor Audit Score** | Average score from manual supervisor audits. |
| **Total Coaching Assignments** | Number of coaching sessions assigned during the selected period. |
| **No. of Fails** | Total number of failed scorecards during the selected period. |
| **Fatal Interactions** | Interactions that failed critical compliance or quality criteria. |
***
## Coaching Insights
Highlights strengths and areas for improvement based on selected scorecards.
### Scorecard Selection
1. Open the **Select Scorecard** dropdown.
2. Choose one or more scorecards.
3. Insights update automatically.
| Display | Description |
| ------------------------ | ------------------------------------------------------------------------------------------------------------------- |
| **Strongest Attributes** | Top 5 attributes scoring 80 or higher, ordered by performance. Use to identify and leverage peak performance areas. |
| **Opportunity Areas** | Bottom 5 attributes scoring below 80, prioritized by lowest scores. Use to focus coaching and training efforts. |
Both lists update in real-time when scorecards change. A scroll option appears when more than 5 attributes exist.
 ***
## Sentiment Insights
Shows customer sentiment across the agent's own conversations. Helps agents recognize strengths and identify recurring issues.
| View | Description |
| ------------------------------------- | ---------------------------------------------------------------------------------------- |
| **Average Sentiment Score** | Average sentiment across all topics, with positive/negative counts and trend indicators. |
| **Top 5 Highest Sentiment L3 Topics** | Five L3 topics with the highest sentiment scores, in descending order. |
| **Top 5 Lowest Sentiment L3 Topics** | Five L3 topics with the lowest sentiment scores, in ascending order. |
**Visual indicators:**
* Green = Positive sentiment
* Red = Negative sentiment
**Drill-down options:**
* **View All Topics**: Opens Topic Discovery filtered to the agent's conversations.
* **View Conversations**: Opens Conversation Mining filtered to the selected topic.
***
## Sentiment Insights
Shows customer sentiment across the agent's own conversations. Helps agents recognize strengths and identify recurring issues.
| View | Description |
| ------------------------------------- | ---------------------------------------------------------------------------------------- |
| **Average Sentiment Score** | Average sentiment across all topics, with positive/negative counts and trend indicators. |
| **Top 5 Highest Sentiment L3 Topics** | Five L3 topics with the highest sentiment scores, in descending order. |
| **Top 5 Lowest Sentiment L3 Topics** | Five L3 topics with the lowest sentiment scores, in ascending order. |
**Visual indicators:**
* Green = Positive sentiment
* Red = Negative sentiment
**Drill-down options:**
* **View All Topics**: Opens Topic Discovery filtered to the agent's conversations.
* **View Conversations**: Opens Conversation Mining filtered to the selected topic.
 ***
## Resolution Insights
Shows how effectively the agent resolves customer issues.
| View | Description |
| -------------------------------------- | -------------------------------------------------------------------------- |
| **Average Resolution Rate** | Agent's overall resolution rate across all conversations. |
| **Top 5 Highest Resolution L3 Topics** | Five L3 topics with the highest resolution rates, in descending order. |
| **Top 5 Lowest Resolution L3 Topics** | Five L3 topics with the lowest resolution rates, in ascending order. |
| **Resolved/Unresolved Breakdown** | Counts and percentages of resolved and unresolved conversations per topic. |
**Drill-down options:**
* **View All Topics**: Opens Topic Discovery filtered to the agent's conversations.
* **View Conversations**: Opens Conversation Mining filtered to the selected L3 topic.
***
## Resolution Insights
Shows how effectively the agent resolves customer issues.
| View | Description |
| -------------------------------------- | -------------------------------------------------------------------------- |
| **Average Resolution Rate** | Agent's overall resolution rate across all conversations. |
| **Top 5 Highest Resolution L3 Topics** | Five L3 topics with the highest resolution rates, in descending order. |
| **Top 5 Lowest Resolution L3 Topics** | Five L3 topics with the lowest resolution rates, in ascending order. |
| **Resolved/Unresolved Breakdown** | Counts and percentages of resolved and unresolved conversations per topic. |
**Drill-down options:**
* **View All Topics**: Opens Topic Discovery filtered to the agent's conversations.
* **View Conversations**: Opens Conversation Mining filtered to the selected L3 topic.
 ***
## Scorecard Trend
Tracks performance over time based on selected scorecards and language preferences.
### Default Settings
| Setting | Behavior |
| --------------------------- | -------------------------------------------------------- |
| **Default Selection** | The oldest assigned scorecard is selected automatically. |
| **Manual Override** | Change the scorecard using the dropdown. |
| **Multi-Scorecard Support** | Compare performance across multiple scorecards. |
### Language Settings
Each scorecard supports its own language settings. The language filter within a scorecard shows only its configured languages. When a scorecard is selected, all its associated languages are auto-selected.
***
## Scorecard Trend
Tracks performance over time based on selected scorecards and language preferences.
### Default Settings
| Setting | Behavior |
| --------------------------- | -------------------------------------------------------- |
| **Default Selection** | The oldest assigned scorecard is selected automatically. |
| **Manual Override** | Change the scorecard using the dropdown. |
| **Multi-Scorecard Support** | Compare performance across multiple scorecards. |
### Language Settings
Each scorecard supports its own language settings. The language filter within a scorecard shows only its configured languages. When a scorecard is selected, all its associated languages are auto-selected.
 ### Time Ranges
| Range | Period |
| ----------- | ------------------------------------- |
| **Daily** | Last 7 days from the current date. |
| **Weekly** | Last 7 weeks from the current week. |
| **Monthly** | Last 7 months from the current month. |
### Avg. Scorecard Score
Displays the average score for the selected scorecard within the chosen date range. If no interactions are scored, the widget shows a blank screen.
### Attributes
Shows all attributes in the selected scorecard and the average score for each within the selected date range. If no interactions are scored, the widget shows a blank screen.
***
## Evaluation Tab
The **Evaluation** tab appears when **Agent Access to Scored Interactions** is enabled in **Quality AI** > **Configure** > **Settings**. If disabled, agents can only view the Overview tab without interaction scores.
Navigate to **Quality AI** > **ANALYZE** > **My Dashboard** > **Evaluation**.
### Time Ranges
| Range | Period |
| ----------- | ------------------------------------- |
| **Daily** | Last 7 days from the current date. |
| **Weekly** | Last 7 weeks from the current week. |
| **Monthly** | Last 7 months from the current month. |
### Avg. Scorecard Score
Displays the average score for the selected scorecard within the chosen date range. If no interactions are scored, the widget shows a blank screen.
### Attributes
Shows all attributes in the selected scorecard and the average score for each within the selected date range. If no interactions are scored, the widget shows a blank screen.
***
## Evaluation Tab
The **Evaluation** tab appears when **Agent Access to Scored Interactions** is enabled in **Quality AI** > **Configure** > **Settings**. If disabled, agents can only view the Overview tab without interaction scores.
Navigate to **Quality AI** > **ANALYZE** > **My Dashboard** > **Evaluation**.
 The Evaluation tab displays automated interaction scores only when the following are enabled in **Quality AI** > **General Settings**: **Auto QA**, **Agent Score Card**, and **Agent Access to Scored Interactions**.
### Available Interaction Views
The interactions displayed depend on the **Agent Access to Scored Interactions** configuration:
| Access Type | Columns Shown |
| -------------------------------------- | ---------------------------------------------------------------------------------- |
| **Only Manually Audited Interactions** | Date & Time, Queue, Supervisor Audit Score. |
| **Manually Audited + Auto QA Scored** | Date & Time, Queue, Auto QA Score (Kore Evaluation Score), Supervisor Audit Score. |
### Filtering Options
| Access Type | Available Filters |
| ------------------------------ | ------------------------------------------------------------------------------------------- |
| **Only Manually Audited** | Queues (limited to queues the agent belongs to). |
| **Manually Audited + Auto QA** | Queues and Audit Status (Audit Status visible only when Auto QA interactions are included). |
### Comments and Transcripts
* Agents can view transcripts and comments only for interactions assigned to them.
* Comments appear within the **Transcript** section of the **Audit** tab.
The Evaluation tab displays automated interaction scores only when the following are enabled in **Quality AI** > **General Settings**: **Auto QA**, **Agent Score Card**, and **Agent Access to Scored Interactions**.
### Available Interaction Views
The interactions displayed depend on the **Agent Access to Scored Interactions** configuration:
| Access Type | Columns Shown |
| -------------------------------------- | ---------------------------------------------------------------------------------- |
| **Only Manually Audited Interactions** | Date & Time, Queue, Supervisor Audit Score. |
| **Manually Audited + Auto QA Scored** | Date & Time, Queue, Auto QA Score (Kore Evaluation Score), Supervisor Audit Score. |
### Filtering Options
| Access Type | Available Filters |
| ------------------------------ | ------------------------------------------------------------------------------------------- |
| **Only Manually Audited** | Queues (limited to queues the agent belongs to). |
| **Manually Audited + Auto QA** | Queues and Audit Status (Audit Status visible only when Auto QA interactions are included). |
### Comments and Transcripts
* Agents can view transcripts and comments only for interactions assigned to them.
* Comments appear within the **Transcript** section of the **Audit** tab.
 ### Language Settings
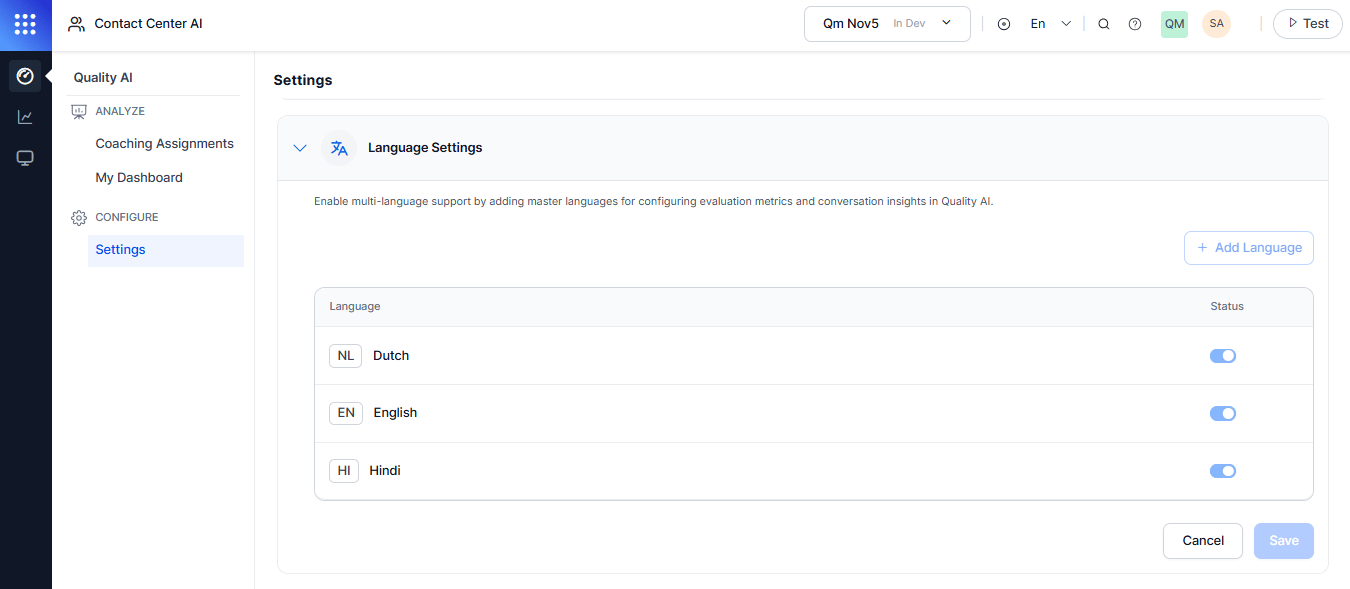
The **Language Settings** section is view-only for agents.
### Language Settings
The **Language Settings** section is view-only for agents.
 ***
Built with [Mintlify](https://mintlify.com).
***
Built with [Mintlify](https://mintlify.com).