> ## Documentation Index
> Fetch the complete documentation index at: https://koreai.mintlify.site/llms.txt
> Use this file to discover all available pages before exploring further.
# Analytics
Monitor agent performance and usage across AI for Work.
***
## Overview
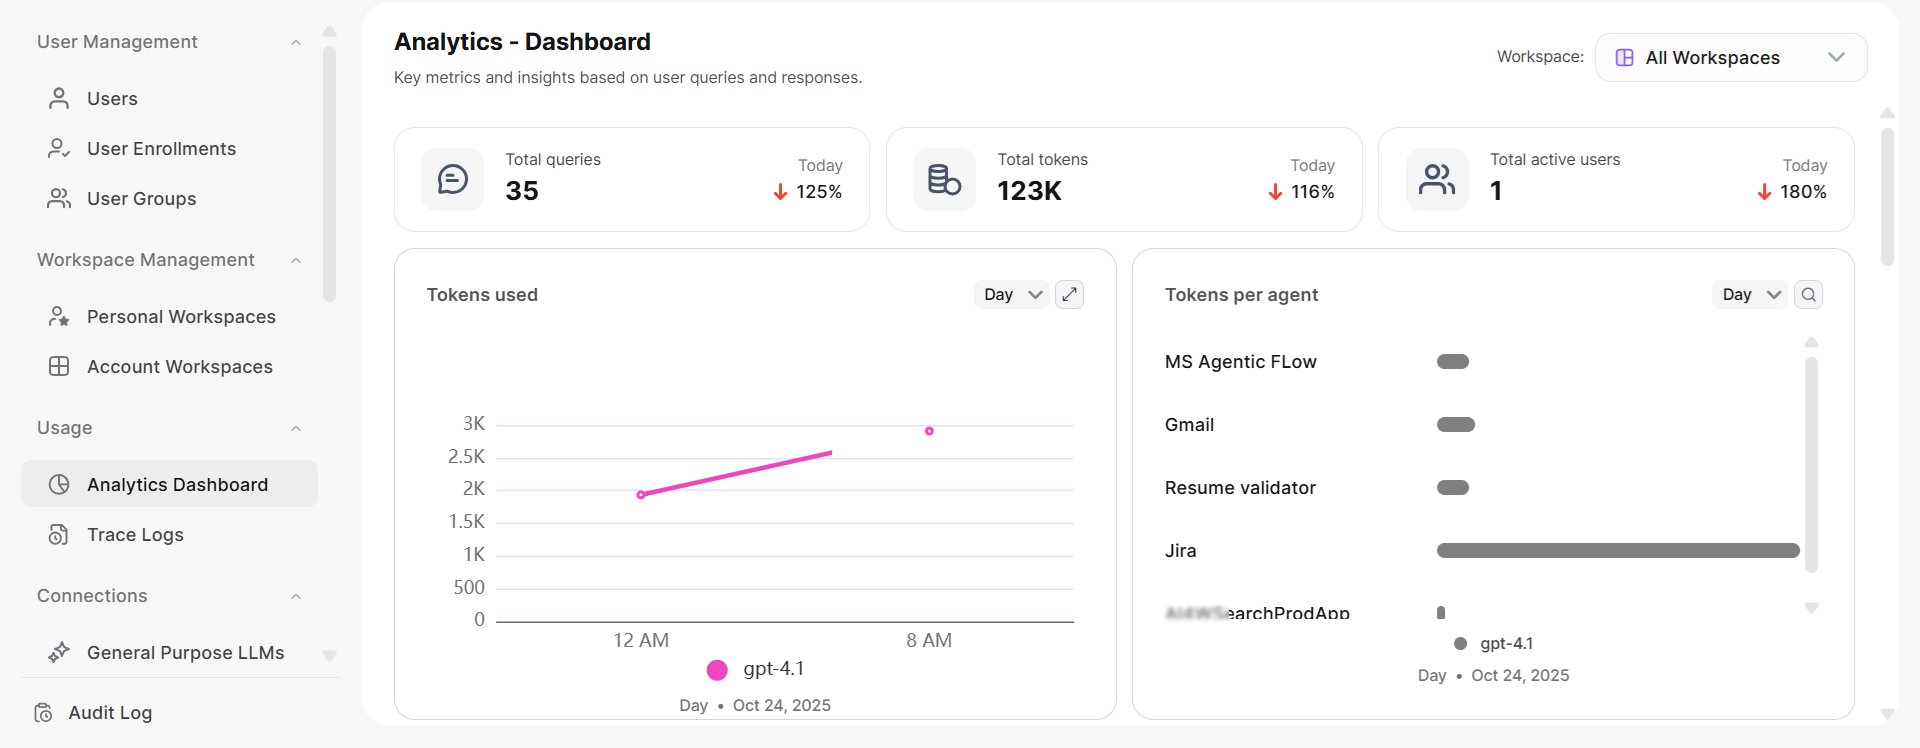
Analytics provides a history of all administrative tasks through two views: the **Dashboard view** and the **Data view**. Switch between them using the toggle at the top right of the Analytics page.
The views display key performance metrics, trends, and reports, enabling you to gauge real-time usage and performance.
 ***
## Dashboard View
The Dashboard view provides graphical reports on usage, performance, and feedback. At the top, you can see the total queries, total tokens, and total active users for the day.
***
## Dashboard View
The Dashboard view provides graphical reports on usage, performance, and feedback. At the top, you can see the total queries, total tokens, and total active users for the day.
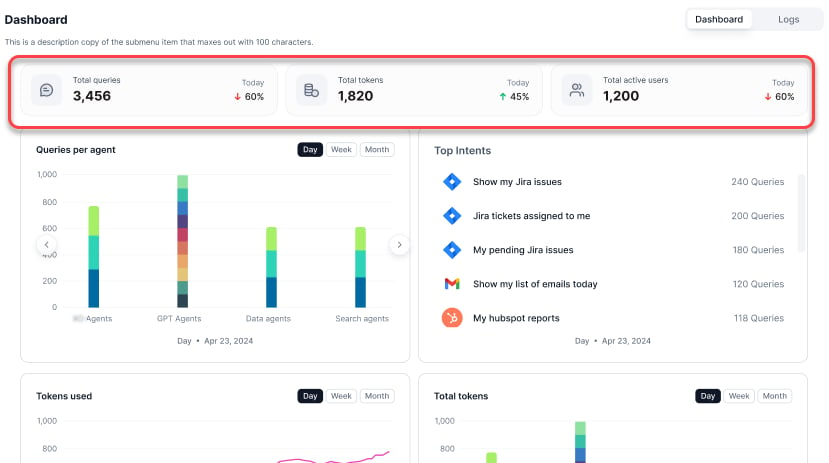 The following reports are available:
| Report | Description |
| ------------------------- | ----------------------------------------- |
| **Tokens Used** | Token usage trends across models |
| **Tokens Per Agent** | Token consumption broken down by agent |
| **Queries Per Agent** | Query volume per agent by type |
| **Top Agents** | Agents ranked by query volume |
| **Top Users** | Top 10 users by query count |
| **Users** | Unique users by platform (web vs. native) |
| **Average Response Time** | Average response time of the service |
| **Errors** | Queries with errors over time |
| **Feedback** | End-user feedback on responses |
All graphical reports support **Day**, **Week**, and **Month** views with left-right navigation for detailed metrics at each time point. Time averaging: 30-minute average (daily), 6-hour average (weekly), daily average (monthly).
***
### Tokens Used
Displays token usage trends across models.
The following reports are available:
| Report | Description |
| ------------------------- | ----------------------------------------- |
| **Tokens Used** | Token usage trends across models |
| **Tokens Per Agent** | Token consumption broken down by agent |
| **Queries Per Agent** | Query volume per agent by type |
| **Top Agents** | Agents ranked by query volume |
| **Top Users** | Top 10 users by query count |
| **Users** | Unique users by platform (web vs. native) |
| **Average Response Time** | Average response time of the service |
| **Errors** | Queries with errors over time |
| **Feedback** | End-user feedback on responses |
All graphical reports support **Day**, **Week**, and **Month** views with left-right navigation for detailed metrics at each time point. Time averaging: 30-minute average (daily), 6-hour average (weekly), daily average (monthly).
***
### Tokens Used
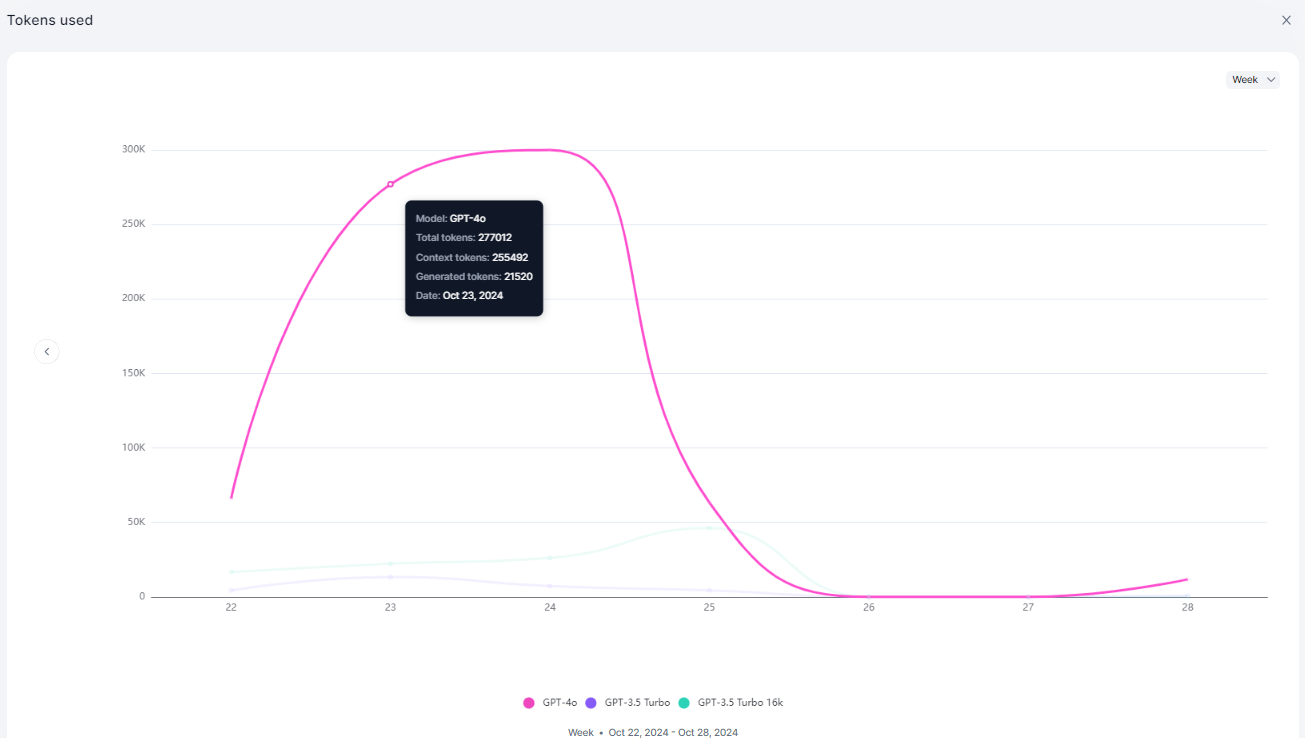
Displays token usage trends across models.
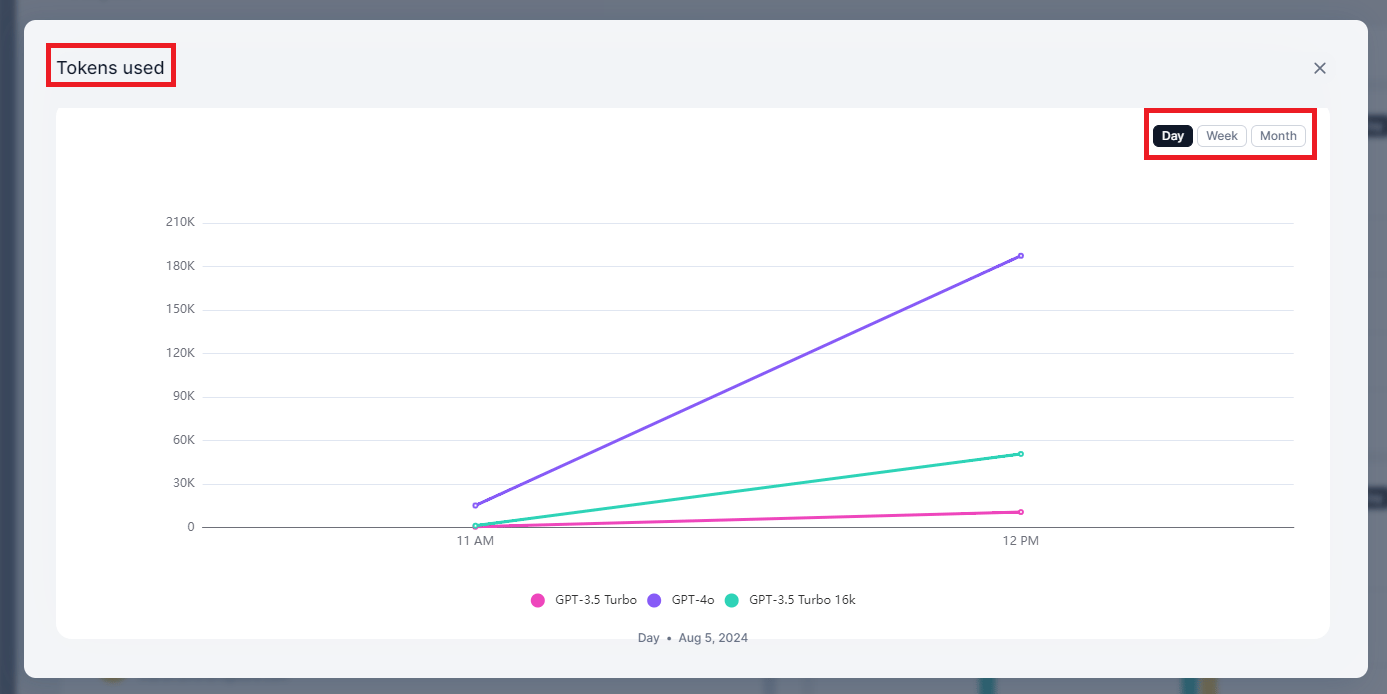 | Metric | Description |
| ----------------- | -------------------------------------- |
| Model Name | The LLM model used |
| Total Tokens Used | Combined context and generation tokens |
| Context Tokens | Tokens in the input/context |
| Generation Tokens | Tokens in the response |
| Timestamp | Date and time of usage |
| Metric | Description |
| ----------------- | -------------------------------------- |
| Model Name | The LLM model used |
| Total Tokens Used | Combined context and generation tokens |
| Context Tokens | Tokens in the input/context |
| Generation Tokens | Tokens in the response |
| Timestamp | Date and time of usage |
 ***
### Tokens Per Agent
Displays token consumption broken down by agent.
***
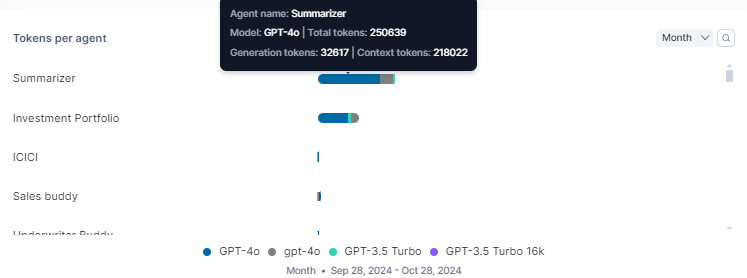
### Tokens Per Agent
Displays token consumption broken down by agent.
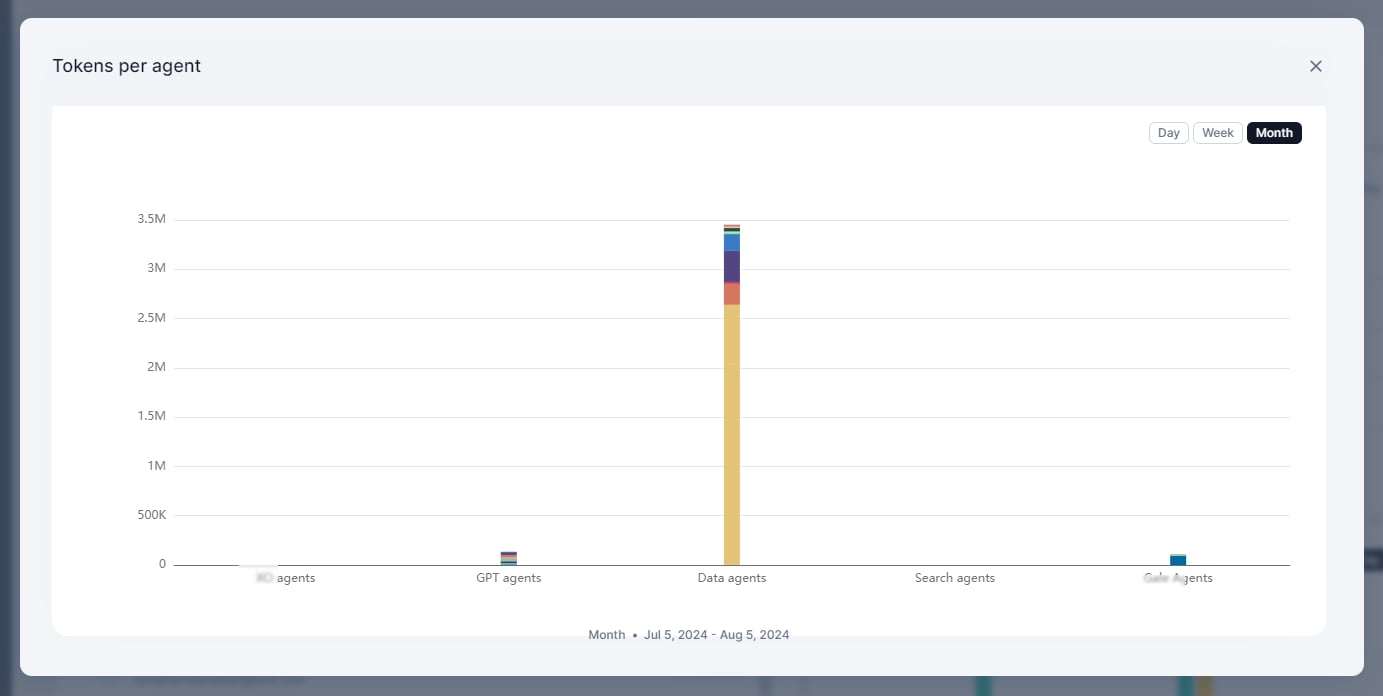 | Metric | Description |
| ---------------------- | -------------------------------------- |
| Agent Name | Name of the agent |
| Model Name | LLM model used by the agent |
| Total Token Count | Combined context and generation tokens |
| Generation Token Count | Tokens in the response |
| Context Token Count | Tokens in the input/context |
| Metric | Description |
| ---------------------- | -------------------------------------- |
| Agent Name | Name of the agent |
| Model Name | LLM model used by the agent |
| Total Token Count | Combined context and generation tokens |
| Generation Token Count | Tokens in the response |
| Context Token Count | Tokens in the input/context |
 ***
### Queries Per Agent
Displays query volume by agent, categorized by agent type: AI for Service, GPT, Data, Search, and Workflow.
***
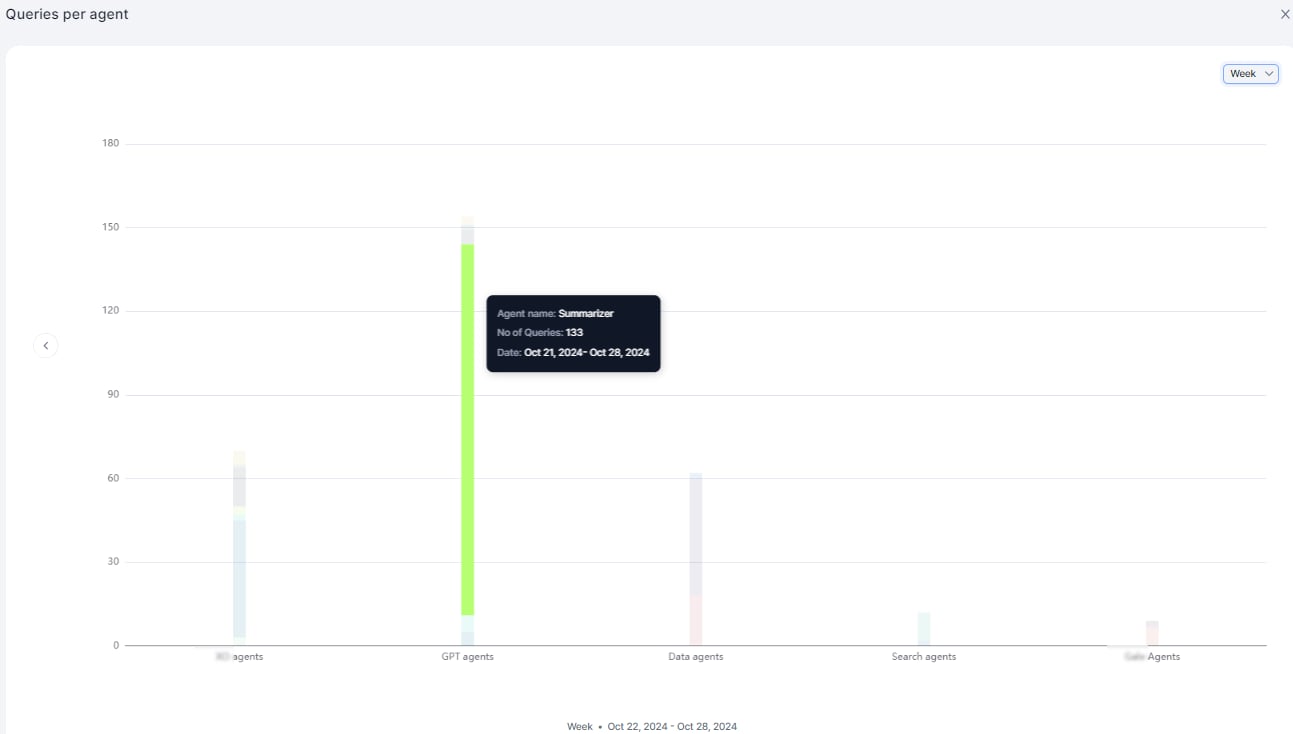
### Queries Per Agent
Displays query volume by agent, categorized by agent type: AI for Service, GPT, Data, Search, and Workflow.
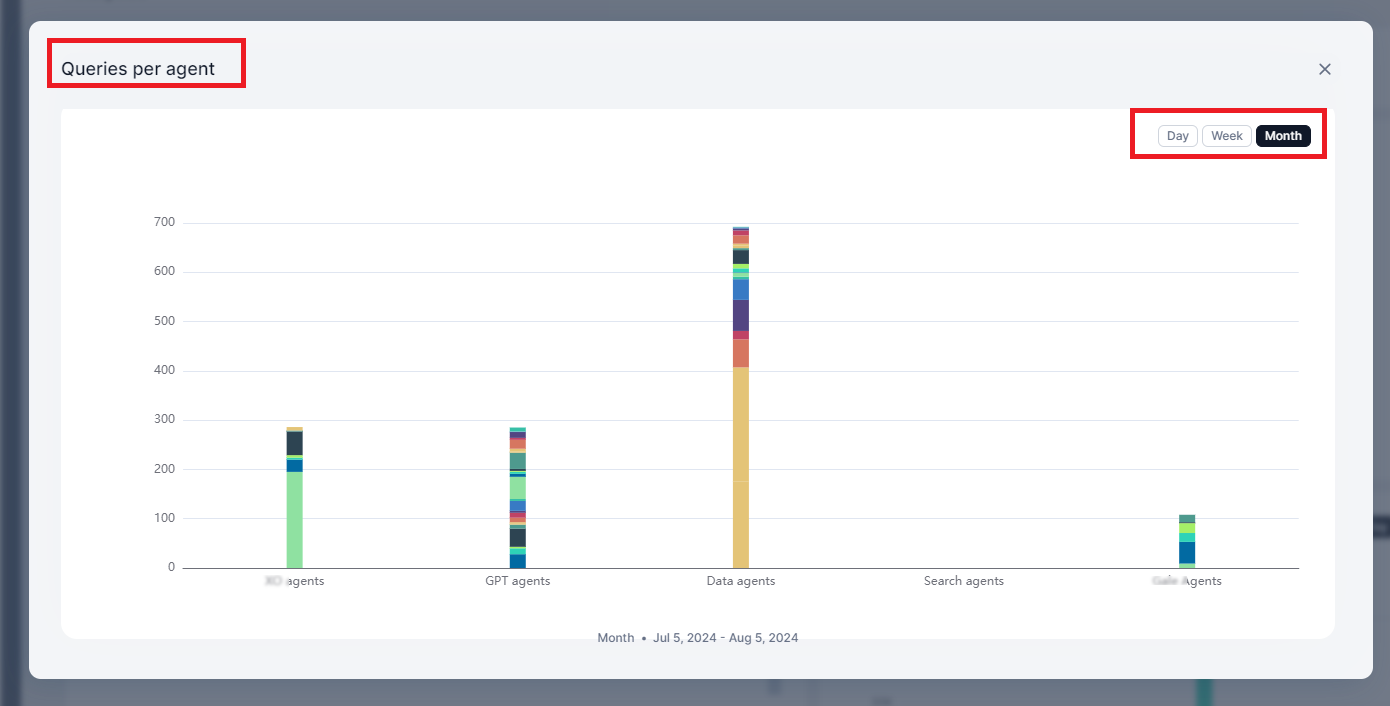 | Metric | Description |
| -------------- | --------------------- |
| Agent Name | Name of the agent |
| No. of Queries | Total queries handled |
| Timestamp | Date and time |
| Metric | Description |
| -------------- | --------------------- |
| Agent Name | Name of the agent |
| No. of Queries | Total queries handled |
| Timestamp | Date and time |
 ***
### Top Agents
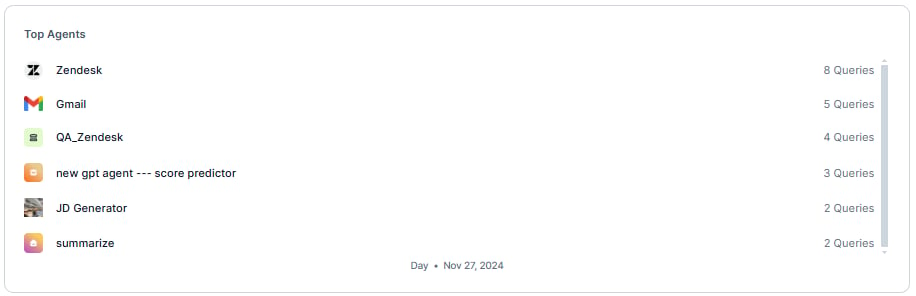
Displays agents ranked by query volume in descending order.
***
### Top Agents
Displays agents ranked by query volume in descending order.
 ***
### Top Users
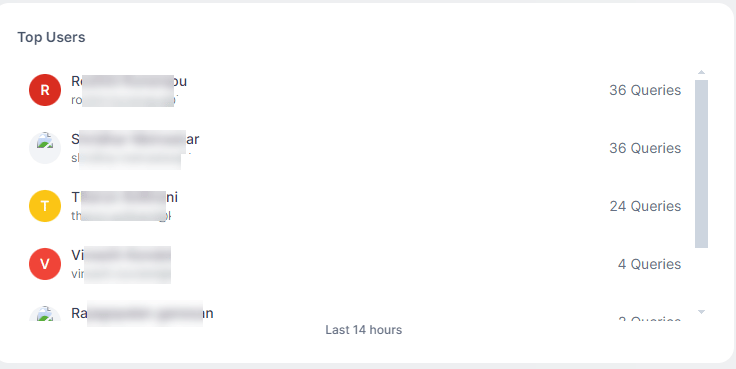
Displays the top 10 users by query count.
***
### Top Users
Displays the top 10 users by query count.
 ***
### Users
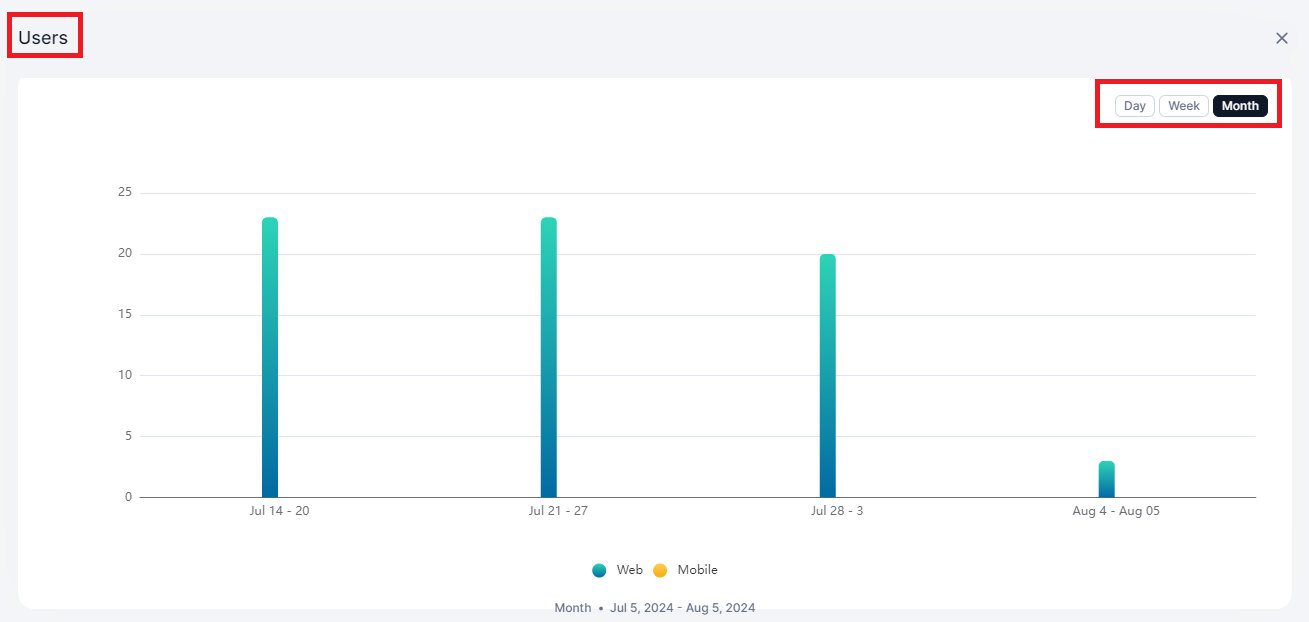
Displays unique users interacting with the system, comparing web vs. native platforms.
***
### Users
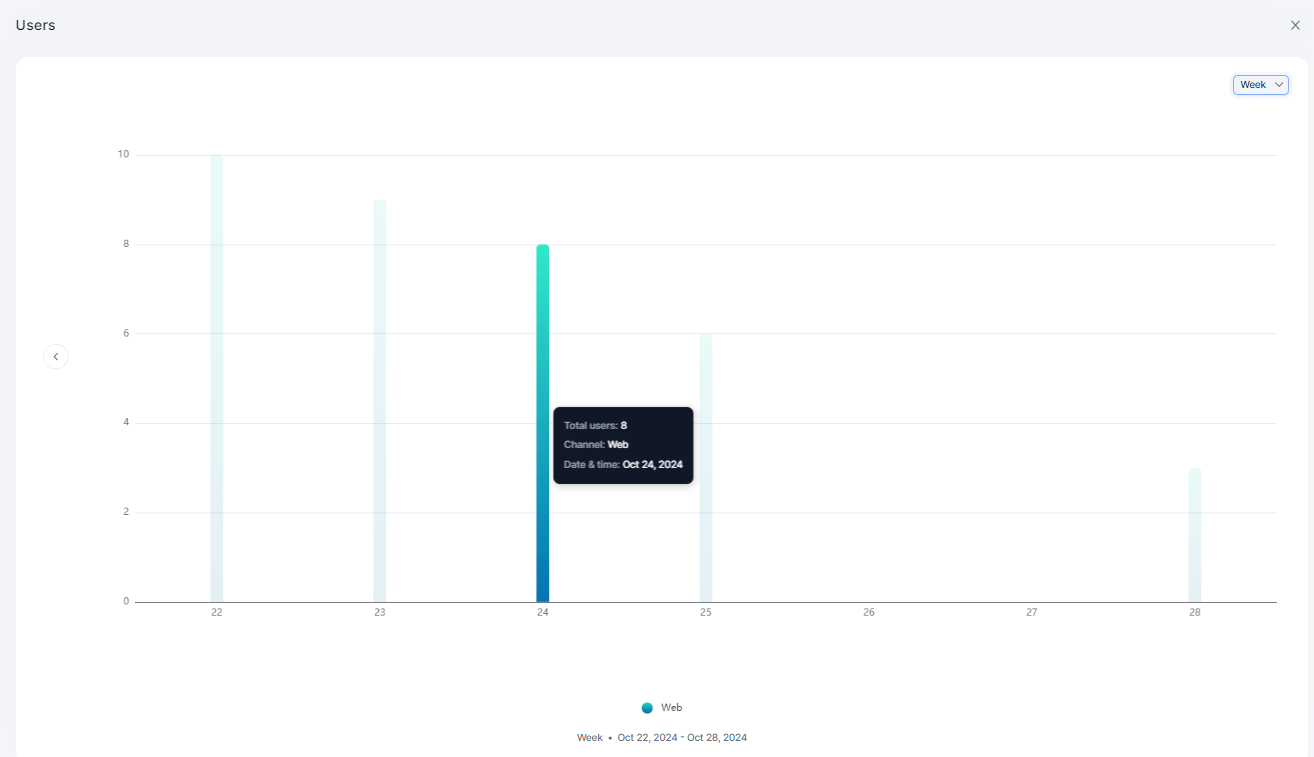
Displays unique users interacting with the system, comparing web vs. native platforms.
 | Metric | Description |
| ----------- | ---------------------- |
| Total Users | Unique user count |
| Channel | Web or native platform |
| Timestamp | Date and time |
| Metric | Description |
| ----------- | ---------------------- |
| Total Users | Unique user count |
| Channel | Web or native platform |
| Timestamp | Date and time |
 ***
### Average Response Time
Displays the average response time of the service over time.
***
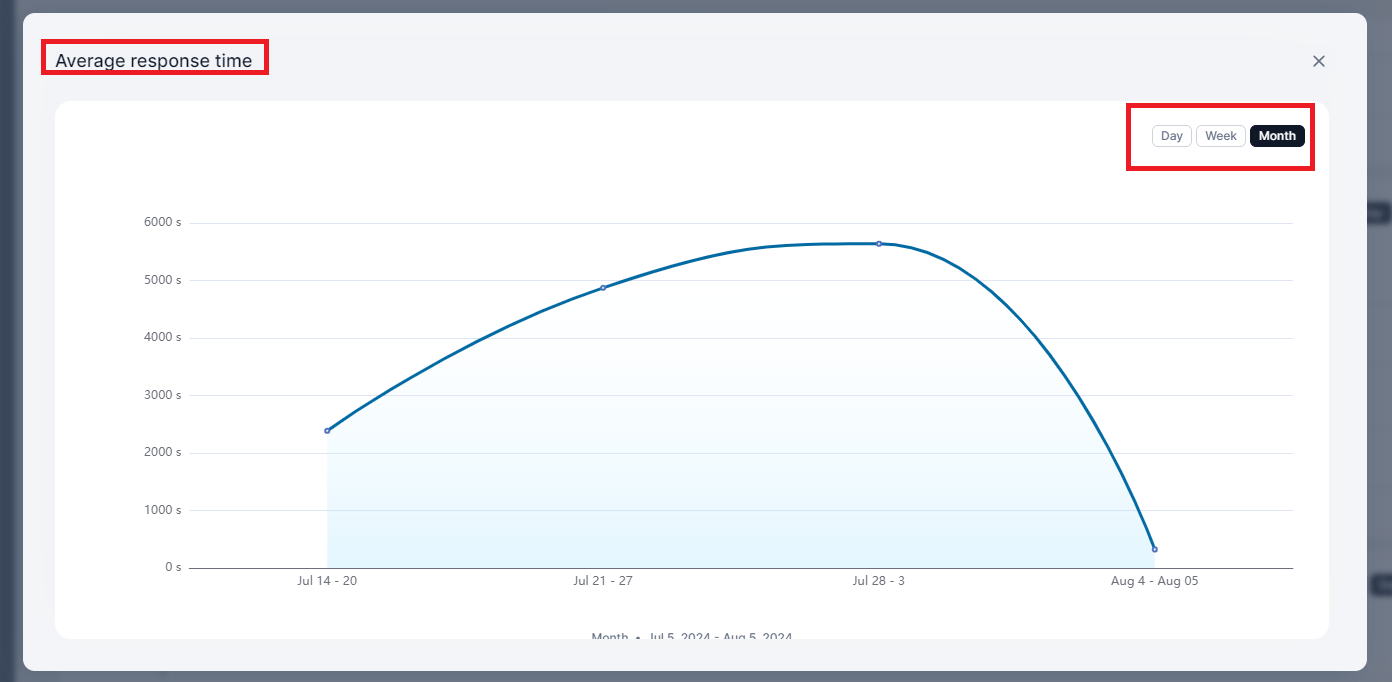
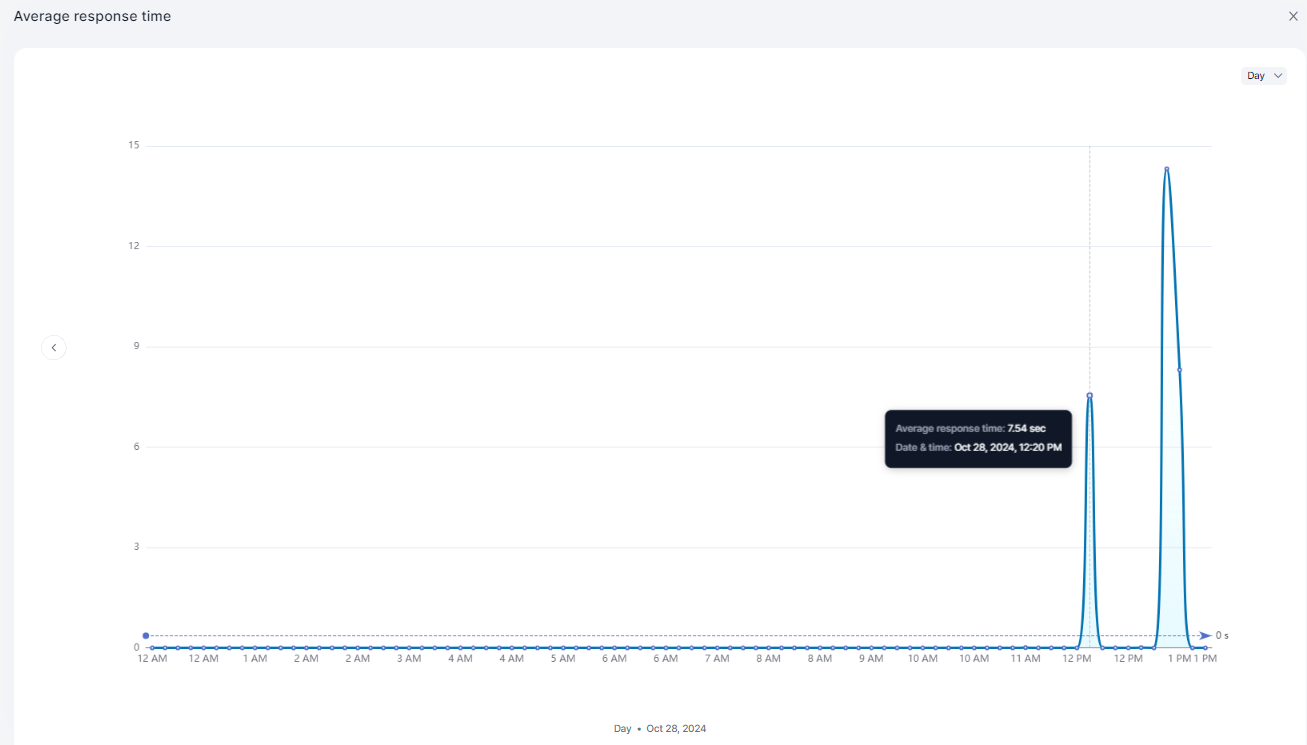
### Average Response Time
Displays the average response time of the service over time.
 | Metric | Description |
| --------------------- | ----------------------------- |
| Average Response Time | Mean response time per period |
| Timestamp | Date and time |
| Metric | Description |
| --------------------- | ----------------------------- |
| Average Response Time | Mean response time per period |
| Timestamp | Date and time |
 ***
### Errors
Displays the number of queries that resulted in errors over time.
***
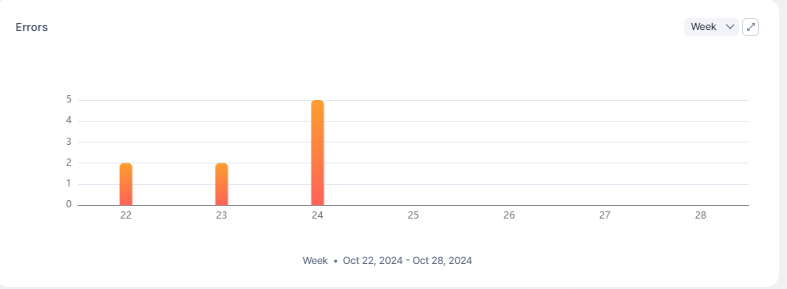
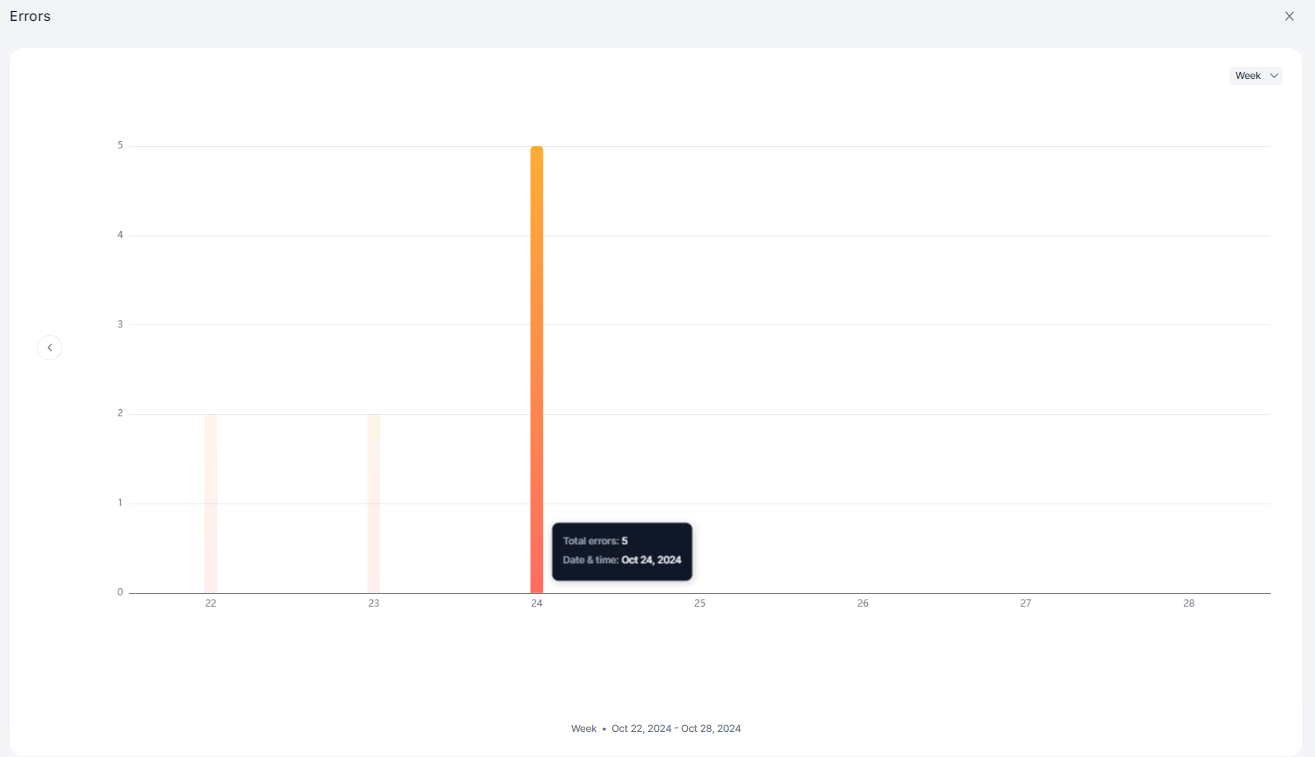
### Errors
Displays the number of queries that resulted in errors over time.
 | Metric | Description |
| ------------ | ------------------------ |
| Total Errors | Count of error responses |
| Timestamp | Date and time |
| Metric | Description |
| ------------ | ------------------------ |
| Total Errors | Count of error responses |
| Timestamp | Date and time |
 ***
### Feedback
Displays end-user feedback on responses.
***
### Feedback
Displays end-user feedback on responses.
 | Metric | Description |
| --------- | --------------------------------- |
| Feedback | Feedback type (positive/negative) |
| Queries | Associated query count |
| Timestamp | Date and time |
***
## Trace Logs
The Trace logs lists individual query records. Each record corresponds to a user utterance.
| Metric | Description |
| --------- | --------------------------------- |
| Feedback | Feedback type (positive/negative) |
| Queries | Associated query count |
| Timestamp | Date and time |
***
## Trace Logs
The Trace logs lists individual query records. Each record corresponds to a user utterance.
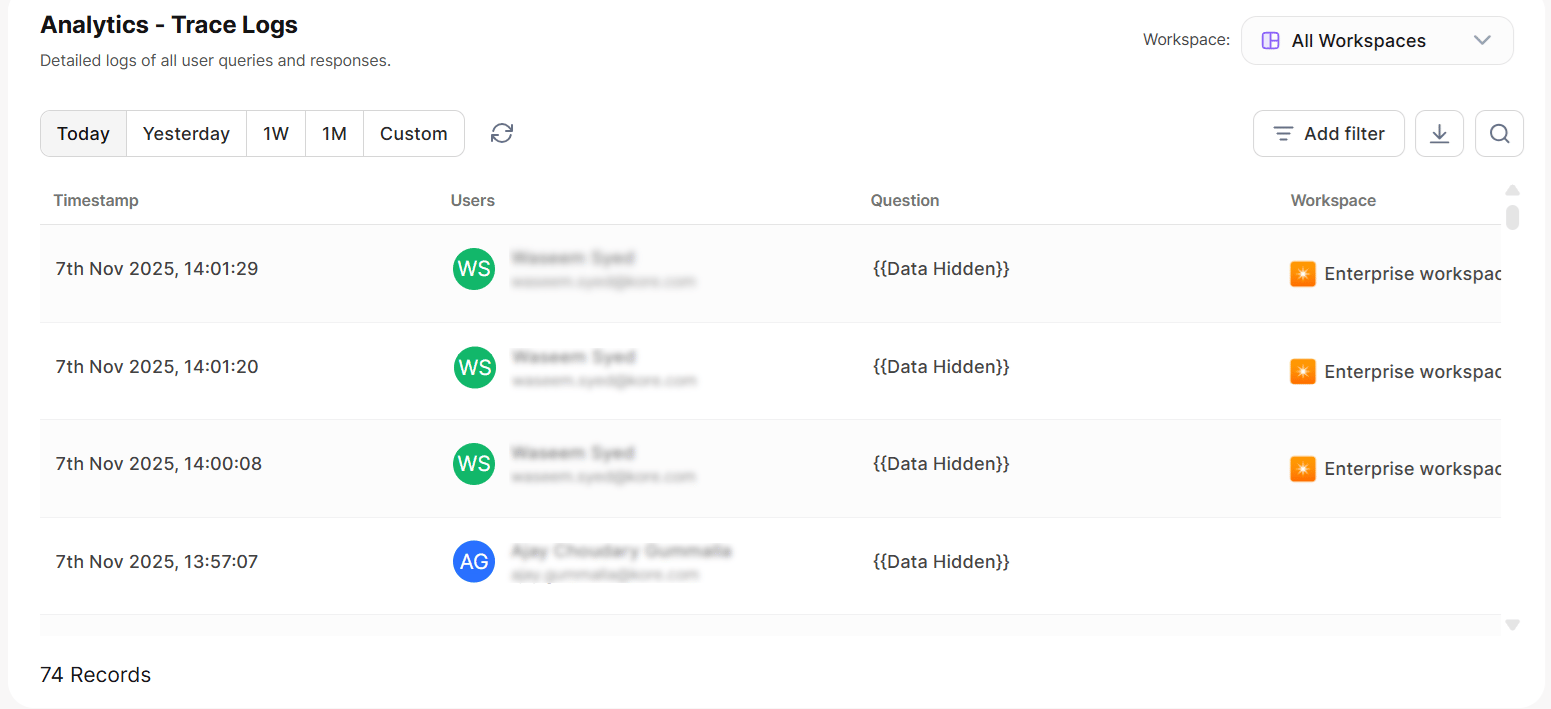 | Column | Description |
| -------------- | ------------------------------------ |
| Request ID | Unique identifier for the request |
| Users | User who submitted the query |
| Questions | The user utterance |
| Overall Tokens | Total tokens consumed |
| Response Time | Time taken to respond |
| Agent Type | Type of agent that handled the query |
| Status | Response status |
| Timestamp | Date and time of the request |
Click **More** on any record to open a detailed view. At the top of the detail panel, you can see the **Response Status**, **Response Time**, and **Feedback Type** for that record.
***
### Record Details
**Request Information**
| Field | Description |
| ------------------- | --------------------------------------- |
| Request ID | Unique identifier |
| User Name and Email | Identity of the user |
| User ID | System user identifier |
| Channel | Mobile or Web |
| Previous Context | Whether prior context was used (Yes/No) |
| Thread ID | Conversation thread identifier |
| Feedback Comments | User-submitted feedback |
| Timestamp | Date and time |
**Query Details**
| Field | Description |
| ------------ | ----------------------------------- |
| Question | The user utterance |
| Query Points | Key points extracted from the query |
**LLM Usage**
| Field | Description |
| --------------- | -------------------- |
| Model | LLM model used |
| Total Tokens | Combined token count |
| Request Tokens | Context/input tokens |
| Response Tokens | Generation tokens |
**Execution Analyzer**
| Column | Description |
| -------------- | ------------------------------------ |
| Request ID | Unique identifier for the request |
| Users | User who submitted the query |
| Questions | The user utterance |
| Overall Tokens | Total tokens consumed |
| Response Time | Time taken to respond |
| Agent Type | Type of agent that handled the query |
| Status | Response status |
| Timestamp | Date and time of the request |
Click **More** on any record to open a detailed view. At the top of the detail panel, you can see the **Response Status**, **Response Time**, and **Feedback Type** for that record.
***
### Record Details
**Request Information**
| Field | Description |
| ------------------- | --------------------------------------- |
| Request ID | Unique identifier |
| User Name and Email | Identity of the user |
| User ID | System user identifier |
| Channel | Mobile or Web |
| Previous Context | Whether prior context was used (Yes/No) |
| Thread ID | Conversation thread identifier |
| Feedback Comments | User-submitted feedback |
| Timestamp | Date and time |
**Query Details**
| Field | Description |
| ------------ | ----------------------------------- |
| Question | The user utterance |
| Query Points | Key points extracted from the query |
**LLM Usage**
| Field | Description |
| --------------- | -------------------- |
| Model | LLM model used |
| Total Tokens | Combined token count |
| Request Tokens | Context/input tokens |
| Response Tokens | Generation tokens |
**Execution Analyzer**
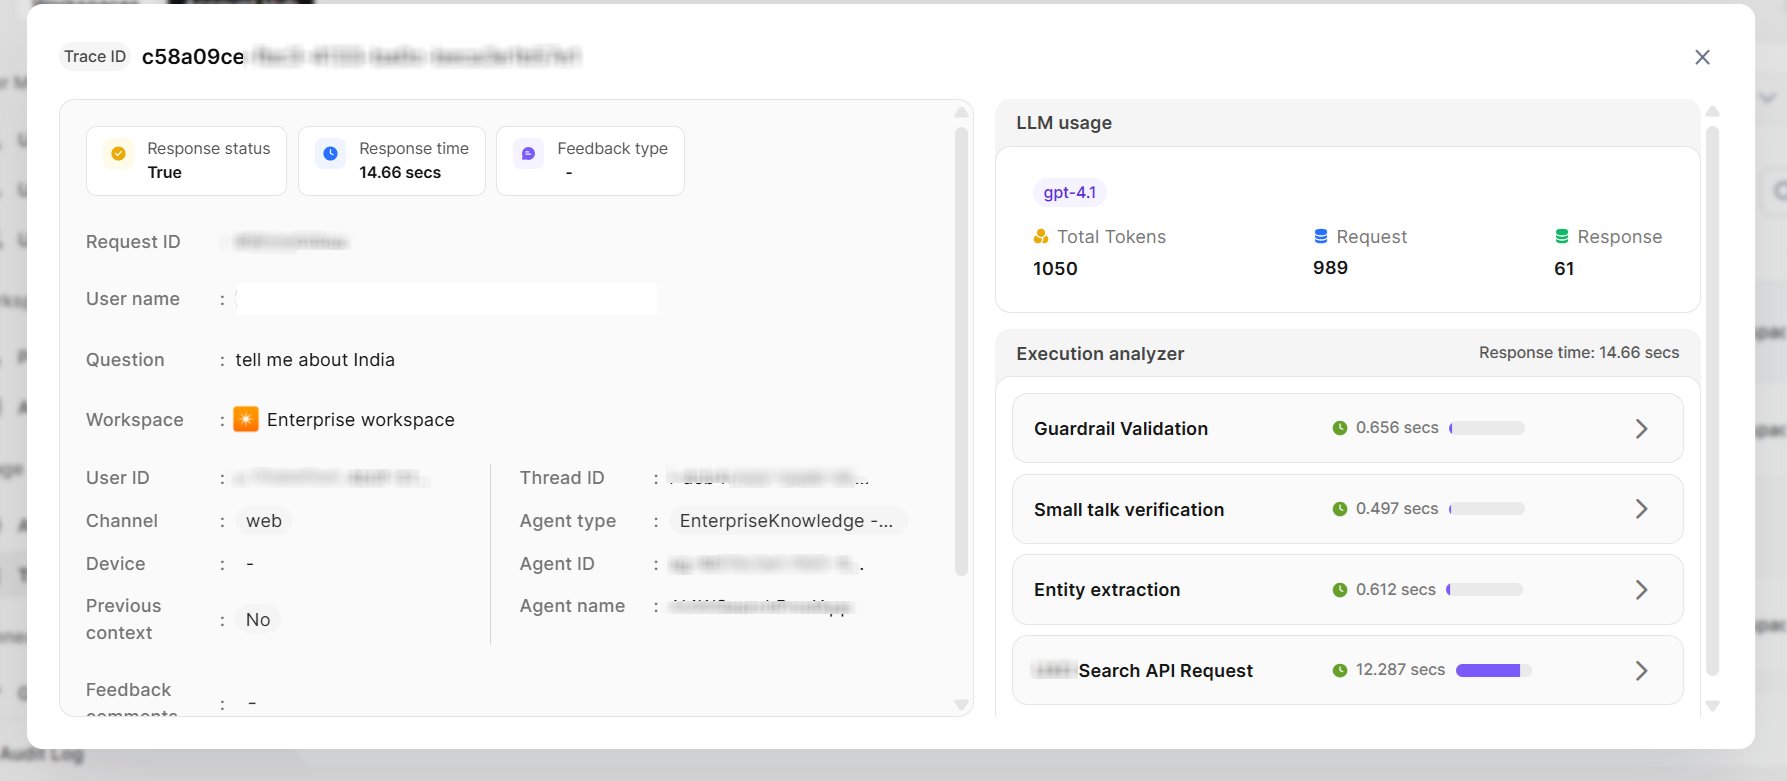 Expand the **Execution Analyzer** to examine each background step. For each step, you can:
* View the exact prompt sent to the model
* Review the model's response
* Debug individual steps to identify issues
***
## Feedback Management
Feedback Management gives administrators visibility into user feedback submitted across the platform, with configurable email notifications and scoped access by role.
**Navigation**: Admin Console → Usage → Feedback
### Accessing the Feedback Page
Access to the Feedback page is role-based:
| Role | Scope |
| ------------------------------------------ | ------------------------------------------------------------------------------------ |
| **Account-level admins** with Usage access | All feedback across the account |
| **Workspace Owners** | Feedback scoped to their workspace only. The **Workspace** column is not shown. |
| **Agent-level access** | Feedback scoped to that specific agent only. The **Agent Name** column is not shown. |
### Feedback Detail View
Click any feedback entry to open its detail view. The view displays the associated trace log and the submitted feedback — type, category, and any additional comments.
### Notify Feedback
Click **Notify Feedback** on the Feedback page to configure email notifications. Select which feedback types should trigger notifications and add recipients. Recipients can be any valid email address or distribution list and do not need to belong to the account.
Notification scope follows the level at which it is configured — account-level covers all workspaces and agents, workspace-level covers all agents in that workspace, and agent-level covers only that specific agent.
**Email notifications include:** user email, query, agent name, workspace, feedback type, feedback category, and additional comments (if provided).
Expand the **Execution Analyzer** to examine each background step. For each step, you can:
* View the exact prompt sent to the model
* Review the model's response
* Debug individual steps to identify issues
***
## Feedback Management
Feedback Management gives administrators visibility into user feedback submitted across the platform, with configurable email notifications and scoped access by role.
**Navigation**: Admin Console → Usage → Feedback
### Accessing the Feedback Page
Access to the Feedback page is role-based:
| Role | Scope |
| ------------------------------------------ | ------------------------------------------------------------------------------------ |
| **Account-level admins** with Usage access | All feedback across the account |
| **Workspace Owners** | Feedback scoped to their workspace only. The **Workspace** column is not shown. |
| **Agent-level access** | Feedback scoped to that specific agent only. The **Agent Name** column is not shown. |
### Feedback Detail View
Click any feedback entry to open its detail view. The view displays the associated trace log and the submitted feedback — type, category, and any additional comments.
### Notify Feedback
Click **Notify Feedback** on the Feedback page to configure email notifications. Select which feedback types should trigger notifications and add recipients. Recipients can be any valid email address or distribution list and do not need to belong to the account.
Notification scope follows the level at which it is configured — account-level covers all workspaces and agents, workspace-level covers all agents in that workspace, and agent-level covers only that specific agent.
**Email notifications include:** user email, query, agent name, workspace, feedback type, feedback category, and additional comments (if provided).