

Prerequisites
- At least one custom script must be deployed and executed via API call or API/Function node. If no script has been deployed and executed yet, or if it has been deployed but not run, no data is displayed.
- If a previously executed script is undeployed, existing run and log data remains accessible. No new runs or logs are generated until the script is redeployed and executed again.
Dashboard overview
The dashboard has two tabs for analyzing script performance:- All Runs — Run-level data including status, deployed version, response time, function, and source.
- Logs — Log-level data for functions executed within the script, including input, output, errors, and debug data.
Customize the view
In All Runs, all columns except Executed On can be used as filters. In Logs, all columns except Timestamp can be used as filters.
All Runs
The All Runs tab shows performance metrics and run-level metadata for the selected script.Performance metrics
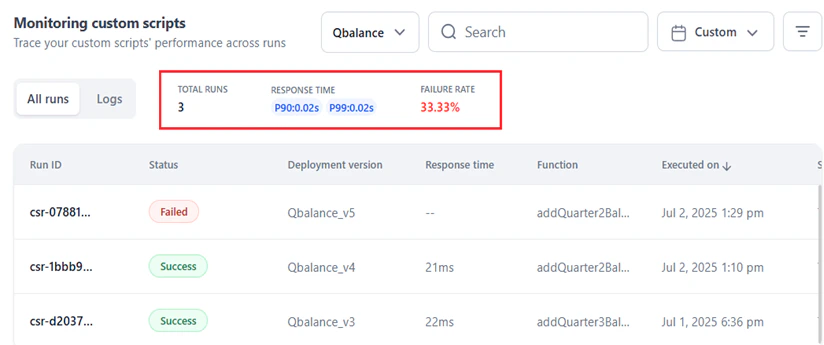
Run-level data
Best practices for All Runs
- Identify runs with low or high response times. Use P90 and P99 thresholds to isolate underperforming runs.
- Analyze the Source and Source Type to diagnose failures, delayed response times, and other issues.
- Click a run record to open the record view for that run.
Logs
The Logs tab shows execution logs captured during script runs.Log visibility depends on how the script is configured:
- Default logging (
print(),console.log()): Logs appear only after the run completes. - korelogger: Logs populate in real-time, with structured log levels (Info, Debug, Warning, Error). See Enhanced logging.
- Failed runs can generate logs if logging is implemented correctly.
Performance metrics
Total Logs indicates the total number of logs recorded during execution. This metric helps determine:- Script activity level — how many actions or events were logged.
- Debugging depth — more logs indicate detailed logging, which aids debugging.
- Execution complexity — a high log count may indicate multiple operations or functions.
- Error visibility — whether sufficient logging is available to trace issues.
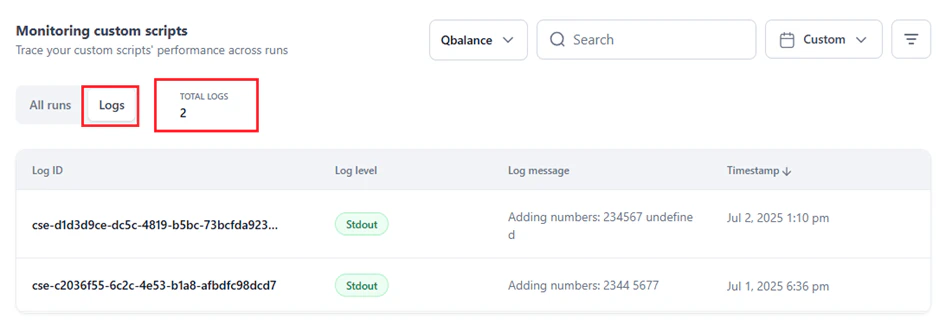
Log-level data
Best practices for Logs
- Analyze the input and output for each run (identified by Run ID) using log data: Log ID, Log level, Log message, and Timestamp.
- Use the input and output code editors in the record view to analyze and troubleshoot logs.
Record view
Click any run in All Runs to open the record view. The record view shows:- Run ID
- Log-level details: Log ID, Log level, Log message, and Timestamp
- JSON editors showing the script’s input and the function’s output
- Navigation buttons (or use
Kfor previous,Jfor next)
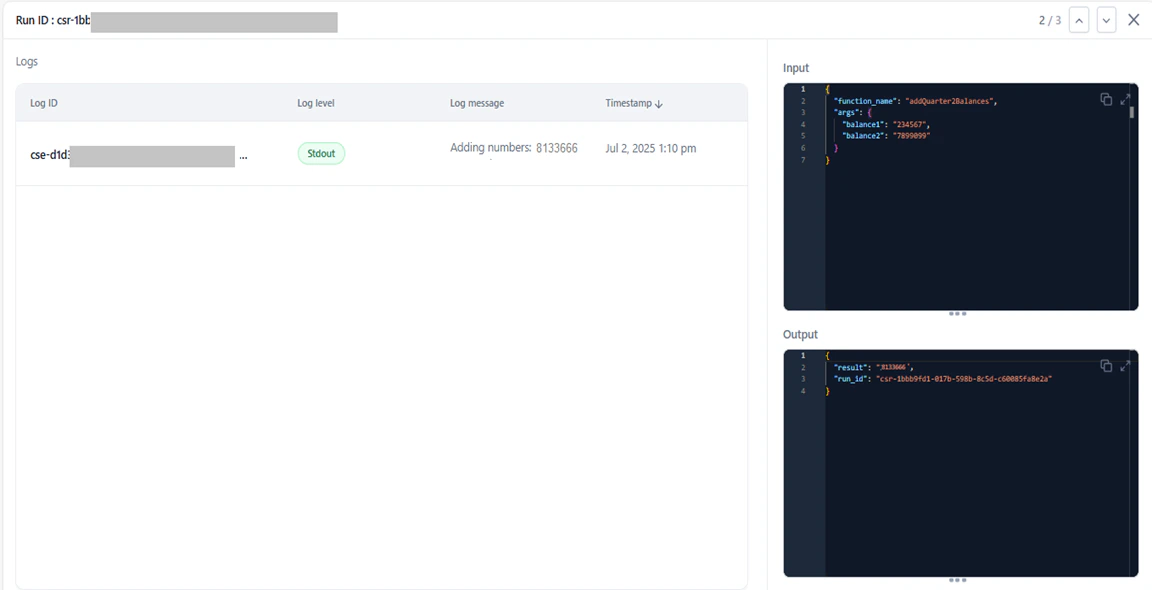
- Trace a specific run for debugging.
- Inspect input and output values.
- Identify failures, performance bottlenecks, unexpected inputs or outputs, and misconfigured logic.
Enhanced logging
The Platform supports two logging options for custom scripts running on the gVisor service.- Standard logging (
print()in Python,console.log()in JavaScript): Logs appear in the Logs tab only after the script execution completes (success or failure). - korelogger: Logs stream in real-time as they are generated. Recommended for live monitoring and debugging due to its log-level control and immediate visibility.
Option 1: Standard logging
Standard logging uses default logging functions. Logs are captured asstdout during script execution.
Example (Python):
stdout:
Option 2: korelogger (recommended)
Thekorelogger library supports structured log levels and enables real-time log streaming. Logs are also captured in stdout in this format:
You can modify the log format as required.
stdout:
Log messages and levels are available as
log.message and log.level in the attributes field.
You can modify the structure of the
attributes field as required.Export runs and logs
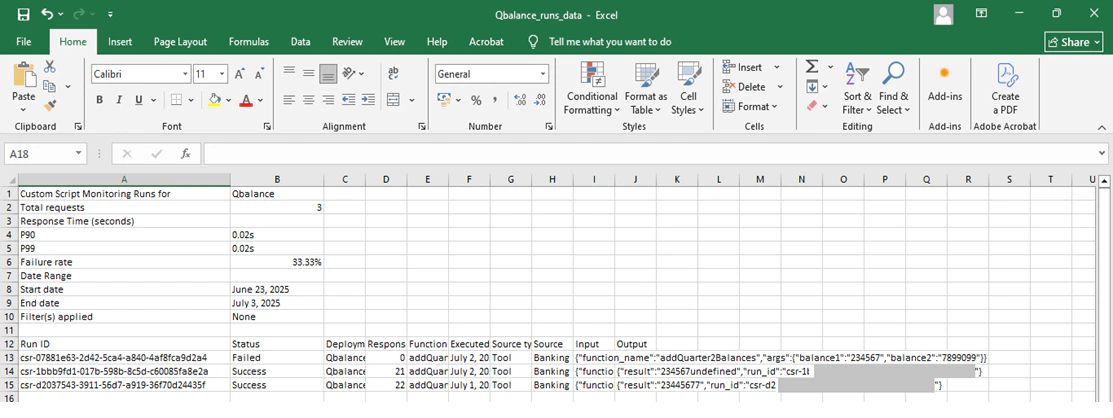
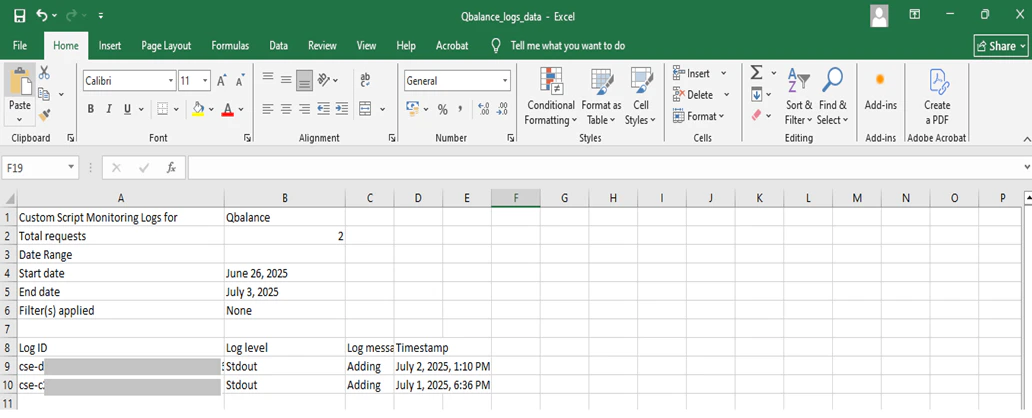
Export All Runs or Logs data as a.csv file. The export reflects the selected date range and applied column filters.
- Select the All Runs or Logs tab.
- Click the Ellipses button (top-right) and select Export.
- Runs data:
<scriptname>_runs_data(example:Qbalance_runs_data) - Logs data:
<scriptname>_logs_data(example:Qbalance_logs_data)
Each user’s export runs independently. One user’s cancellation or adjustment does not affect another user’s export.