

-
Click Analytics on the left navigation pane. The Analytics panel opens with the list of reports.
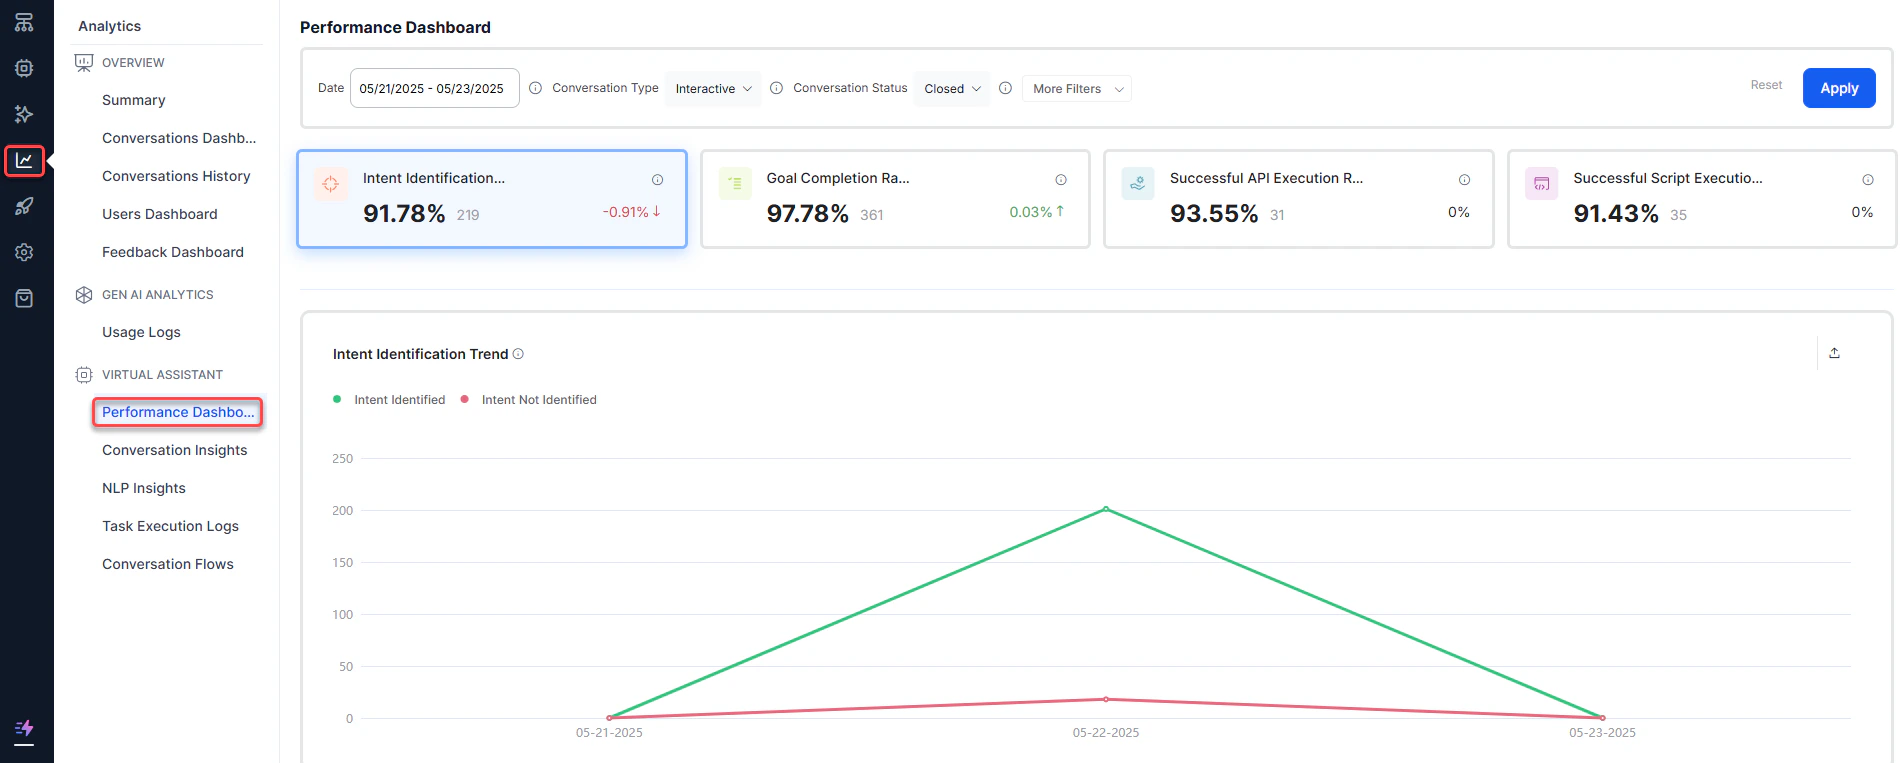
- Click Performance Dashboard under the Automation section of the Analytics panel.
-
Select appropriate filters and click Apply.
Performance Dashboard Metrics
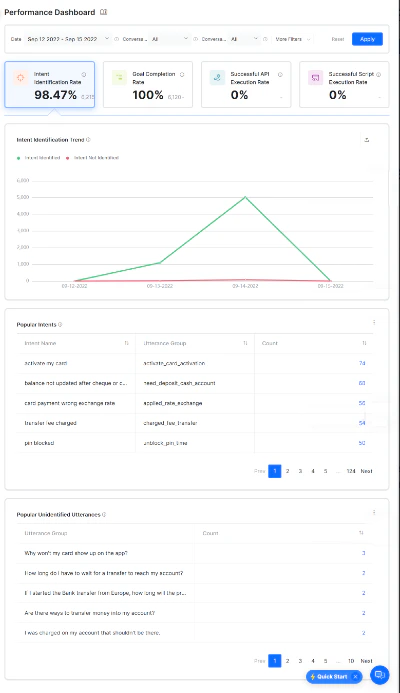
The Performance Dashboard is organized into four categories to identify how an AI Agent performs.Intent Identification Rate
This section provides information on the number of intents that were classified and unclassified. An intent represents the goal the customer has in mind when typing a question or comment — it’s “what they really mean.”| Metric | Description |
|---|---|
| Intent Identification Rate | A scorecard showing the percentage and number of intents identified in a duration, along with the percentage increase or decrease from the last selected period. |
| Intent Identification Trend | A line chart showing total classified vs. unclassified intents over a period of time. |
| Popular Intents | A table with the number of times the AI Agent identified a given intent from user utterances in active and closed conversations. Fields include Intent Name, Utterance Group (the cluster of similar utterances), and Count. Clicking an intent name displays a drill-down view of relevant utterances, channel, user ID, date and time, and chat history. |
| Popular Unidentified Utterances | A table showing utterances that didn’t result in an intent identification, grouped by similarity. |
Goal Completion Rate
This section shows how many tasks the AI Agent completes and fails within a selected time. Failed tasks include both abandoned and incomplete tasks. Tasks include any interaction such as Dialog, FAQs, or alerts.| Metric | Description |
|---|---|
| Goal Completion Rate | A scorecard showing the percentage and number of task executions successfully completed in a duration, along with the percentage increase or decrease from the last selected period. |
| Goal Completion Trend | A line chart plotting successful and failed task executions over time. |
| Task Performance | A table providing the number of successful and failed task executions per task for a selected duration. |
| Failure Point Analysis | A table showing the number of times a task has failed at various nodes. |
API Execution Rate
This section provides information on the number of APIs that were successfully executed and failed. Dialog tasks often use a Service node to make REST or SOAP requests to third-party web services.| Metric | Description |
|---|---|
| API Performance Rate | A scorecard showing the percentage and number of service calls executed successfully, along with the percentage increase or decrease from the last selected period. |
| Service Execution Trend | A line chart plotting the trend of successful and failed service executions over time. |
| Service Performance | A table showing the number of times a service node is executed, its status, and the average response time. |
Script Execution Rate
This section provides information on the number of scripts that were successfully executed and failed. A Script node allows you to write JavaScript code in a dialog task.| Metric | Description |
|---|---|
| Script Performance Rate | A scorecard showing the percentage and number of scripts executed successfully, along with the percentage increase or decrease from the last selected period. |
| Script Execution Trend | A line chart plotting the trend of successful and failed script executions over time. |
| Script Performance | A table showing the number of times a script node is executed, its status, and the average response time. |