
Back to Reports List The Latency Report highlights calls exceeding a defined latency threshold. For example, supervisors can generate a report of all calls where the P90 end-to-end latency is greater than 500 milliseconds (ms).Documentation Index
Fetch the complete documentation index at: https://koreai.mintlify.app/llms.txt
Use this file to discover all available pages before exploring further.
This is a beta feature. To generate Latency reports, enable capturing latency metrics by configuring these call control parameters:
notifySttLatency = truevadEnable = truevadVendor = sileroGenerate and Manage the Report
Refer to Creating a New Report for instructions on generating this report. Refer to Manage Reports for instructions on managing this report. The report is available for download.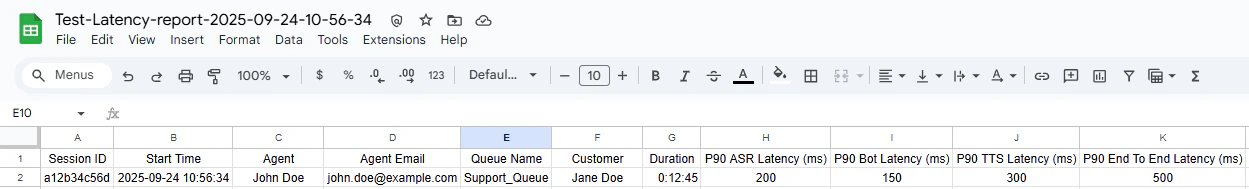
Report Fields
| Field | Description | Example |
|---|---|---|
Session ID | Unique identifier for each interaction session. | a12b34c56d |
Start Time | Timestamp when the session started. | 2025-09-24 10:56:34 |
Agent | Name of the agent handling the session. | John Doe |
Agent Email | Email address of the agent. | john.doe@example.com |
Queue Name | Name of the queue the interaction routes through. | Support_Queue |
Customer | Identifier or name of the customer involved in the session. | Jane Doe |
Duration | Total time the session lasted. | 00:12:45 |
P90 ASR Latency (ms) | 90th percentile latency of Automatic Speech Recognition, in milliseconds. Indicates how long speech-to-text processing takes. | 250 |
P90 Bot Latency (ms) | 90th percentile latency for the bot’s response processing, in milliseconds. Shows system responsiveness. | 120 |
P90 TTS Latency (ms) | 90th percentile latency of Text-to-Speech processing, in milliseconds. Represents the time to convert text into audio. | 180 |
P90 End To End Latency (ms) | 90th percentile overall latency from customer speech to agent/bot reply, in milliseconds. Combines ASR, bot, and TTS processing times. | 600 |