

Contact support to enable Wallboards.
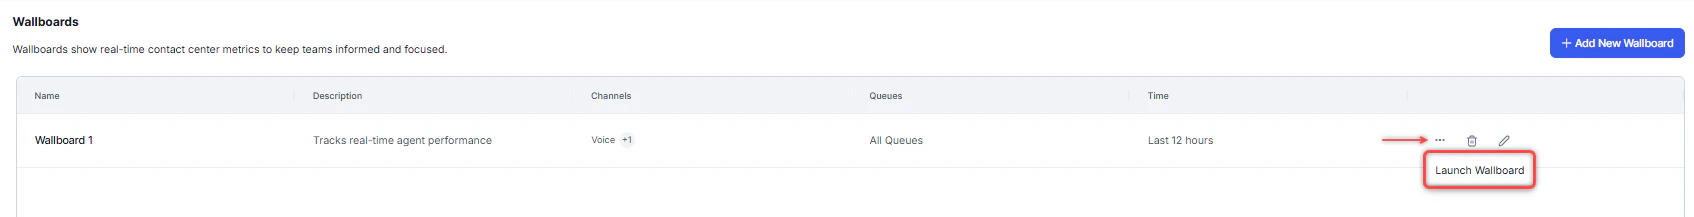
Launch Wallboard
- Select the ellipsis and select Launch Wallboard. The wallboard opens in a new browser tab.
- Dashboard data refreshes every 60 seconds. Live widget data refreshes every second.

Wallboard Widgets
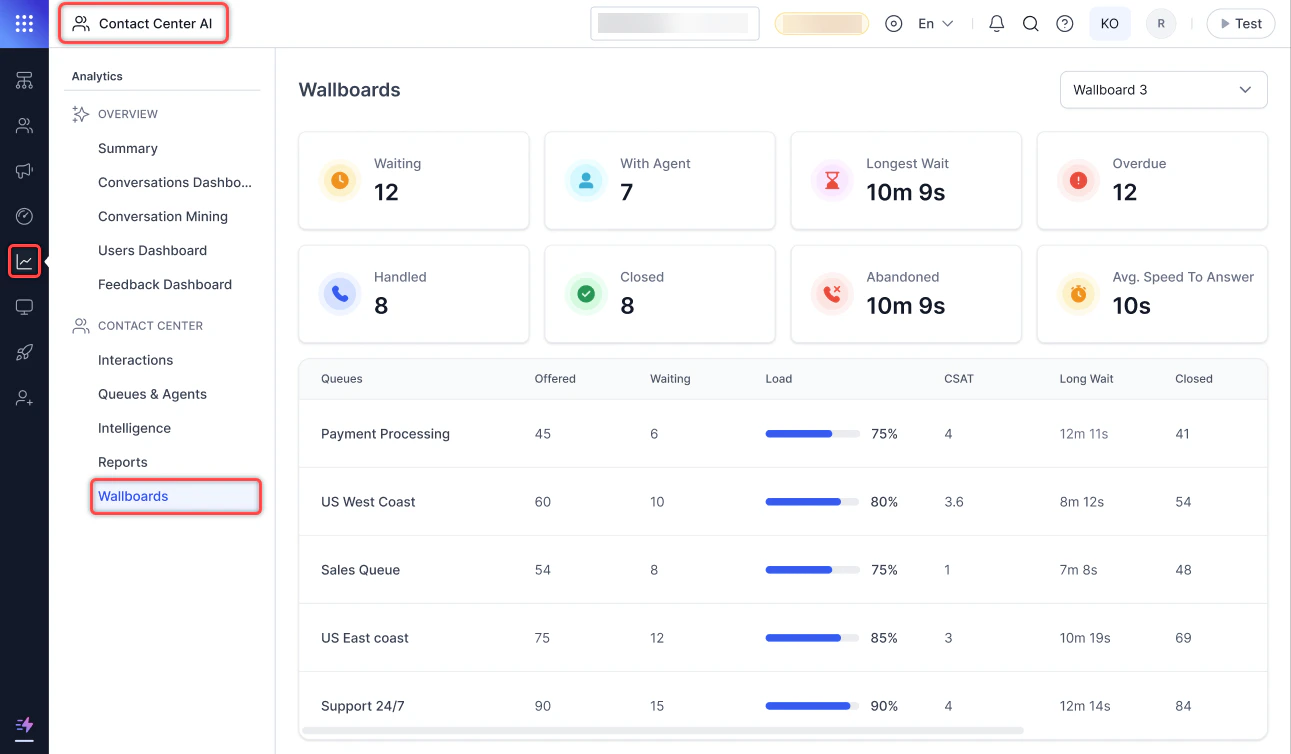
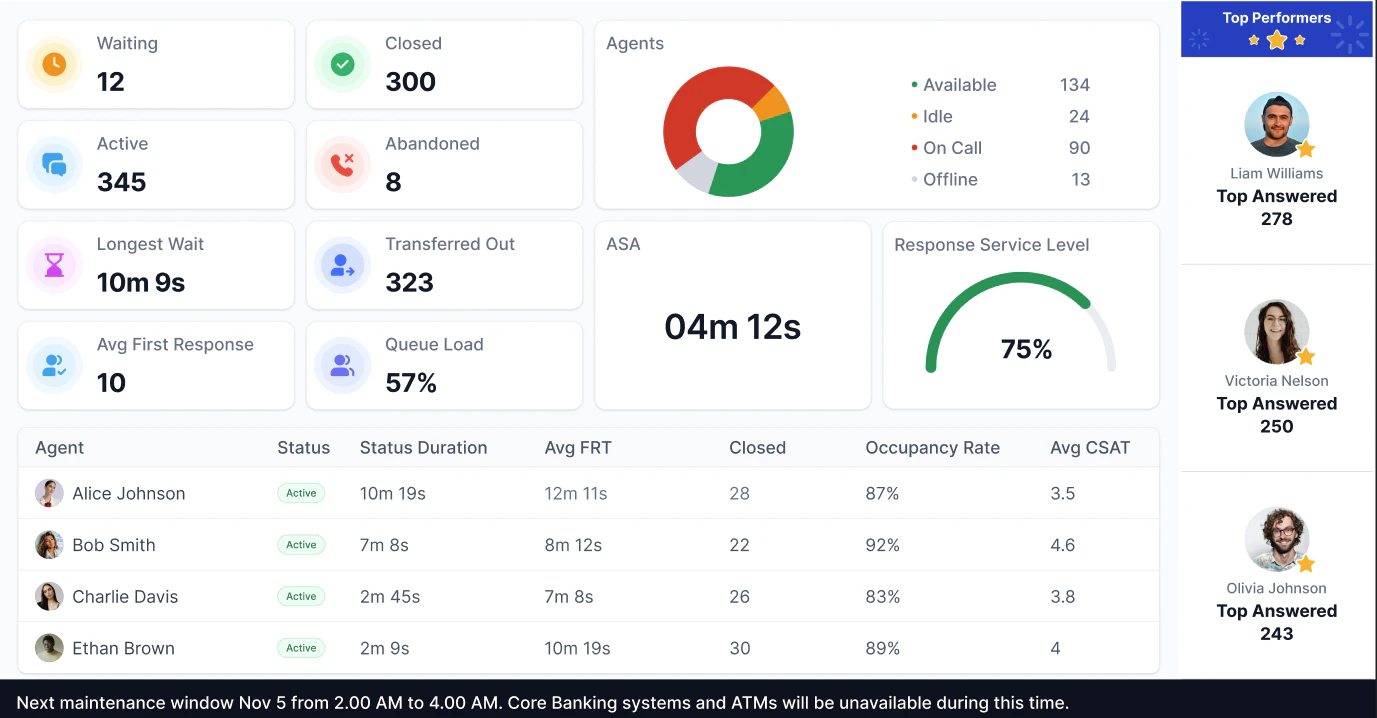
The wallboard displays widgets showing KPI data for the contact center over a configured time duration.Center Wide
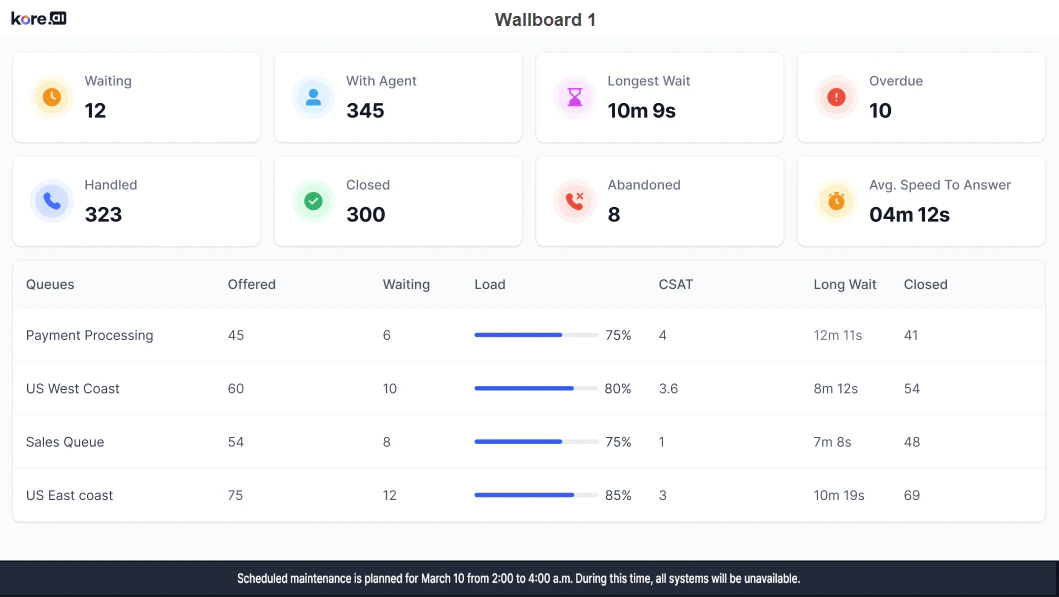
The wallboard name appears at the top.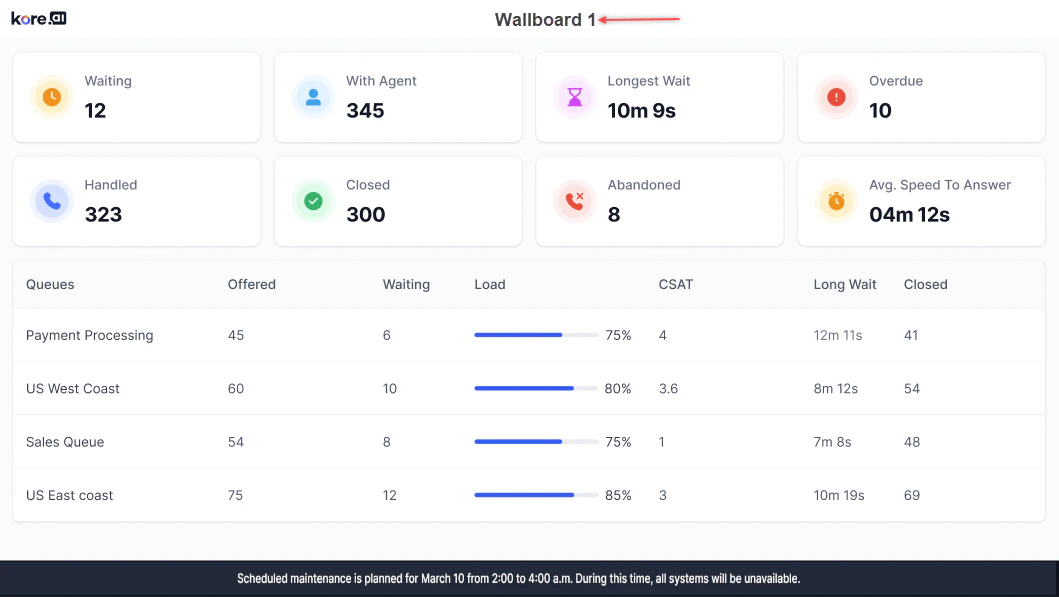
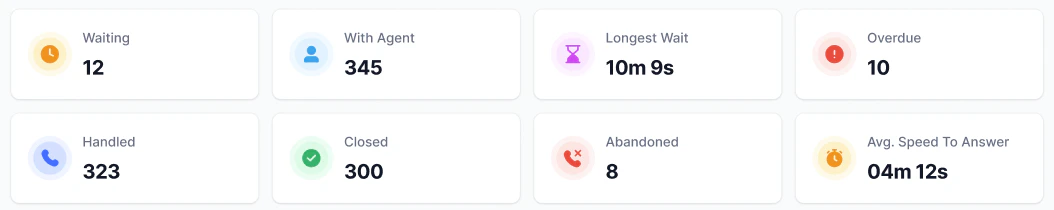
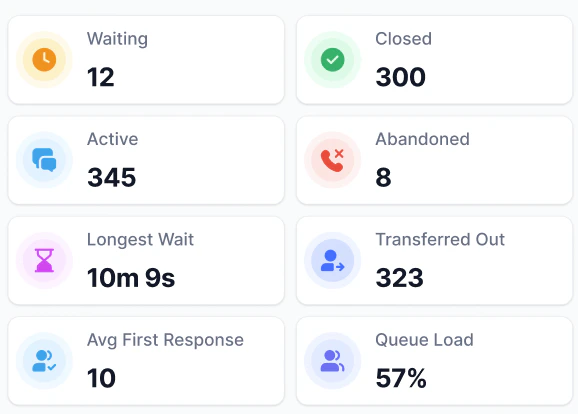
Top Section Widgets
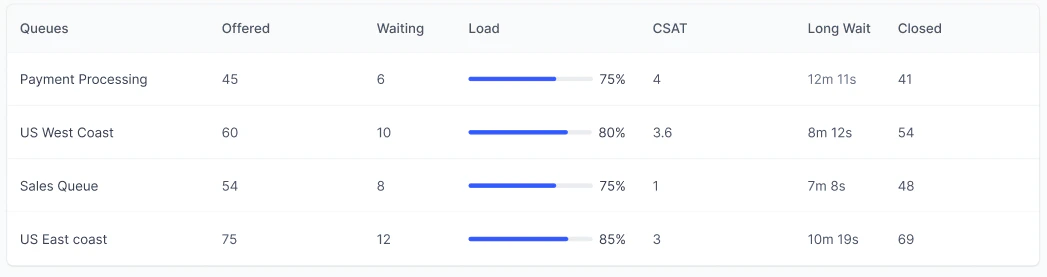
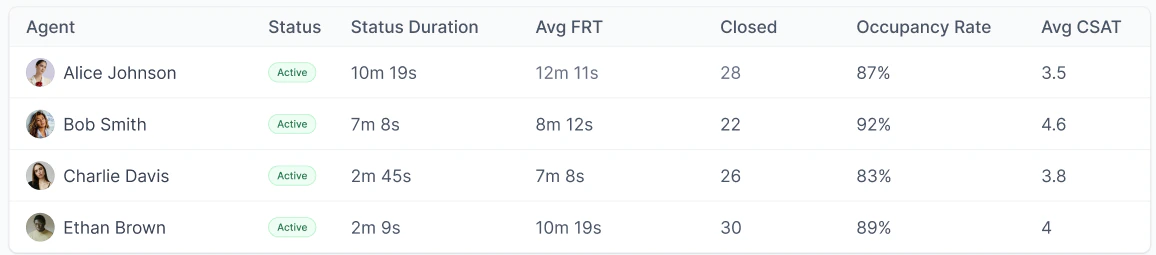
Bottom Section-Queue Data
Queue Specific
The wallboard name appears at the top.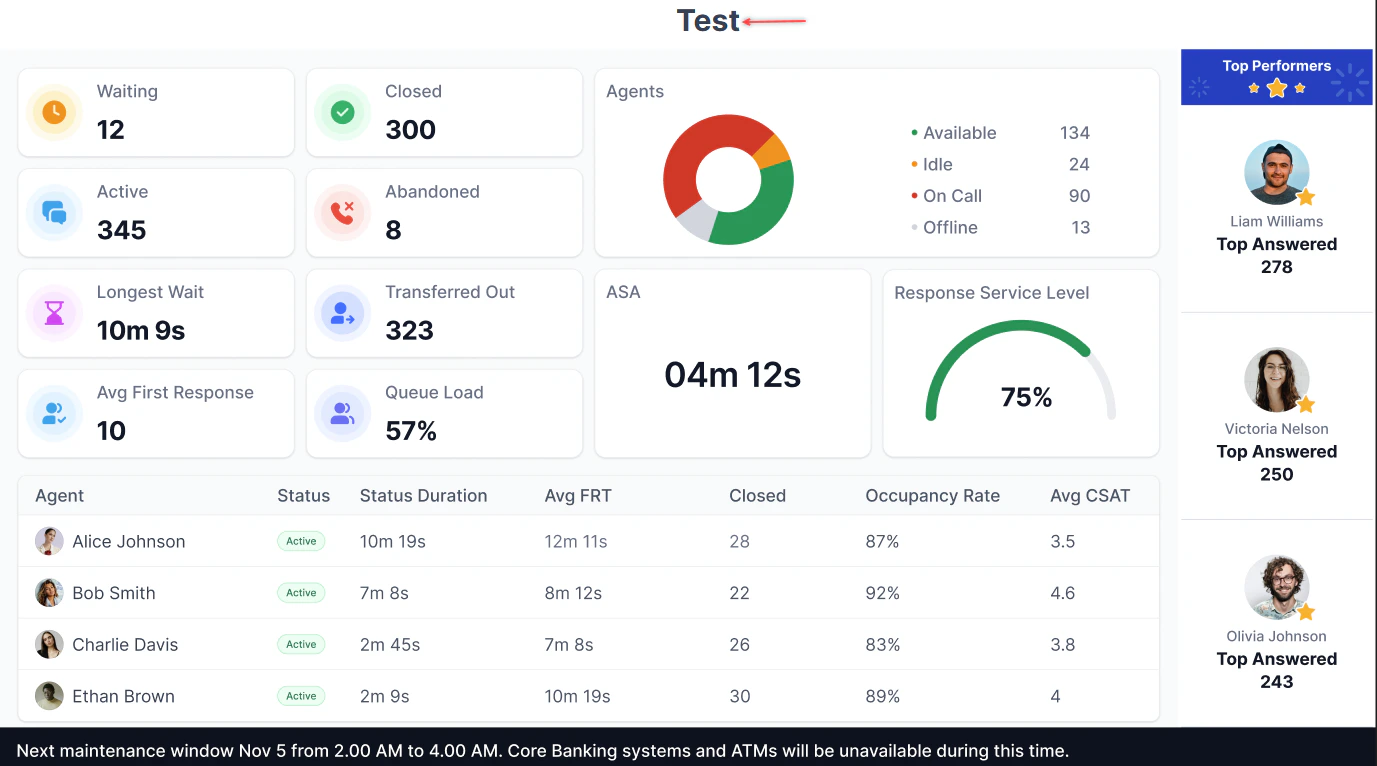
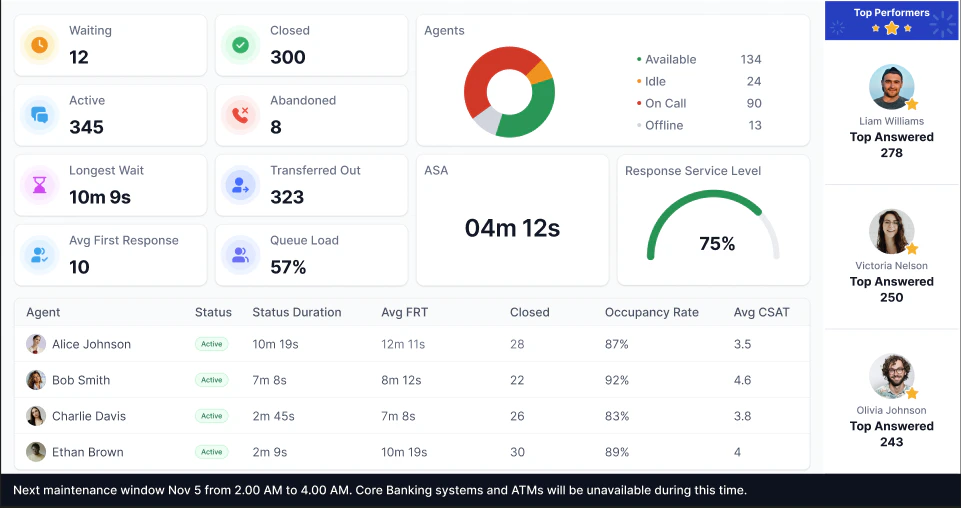
Top Section Widgets
Multiple Insights
Right Section Widgets

Bottom Section-Agent Data
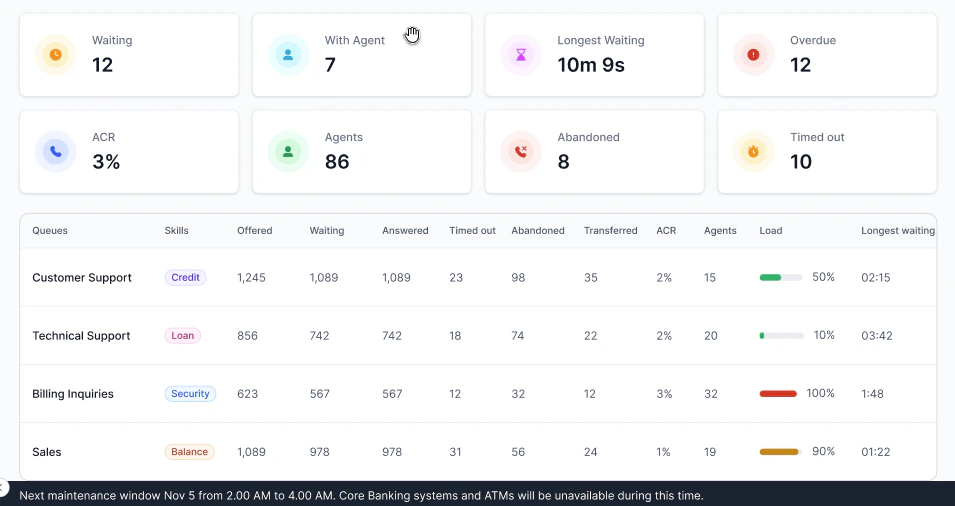
Center Wide Abandoned
The wallboard name appears at the top.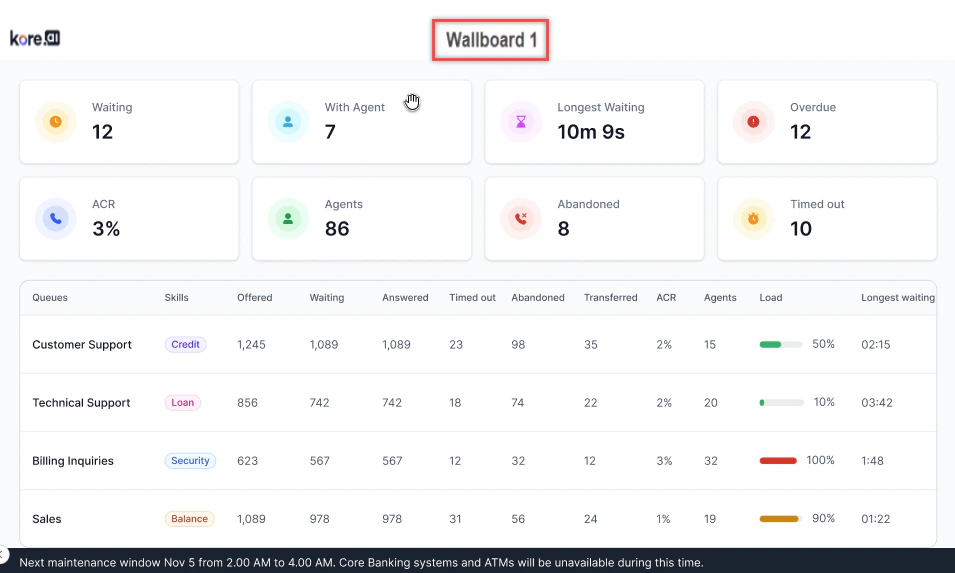
Top Section Widgets
The top section of the wallboard shows the following widgets: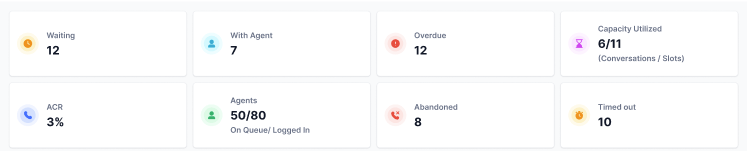
Bottom Section Widgets
The bottom section of the wallboard displays the following queue data.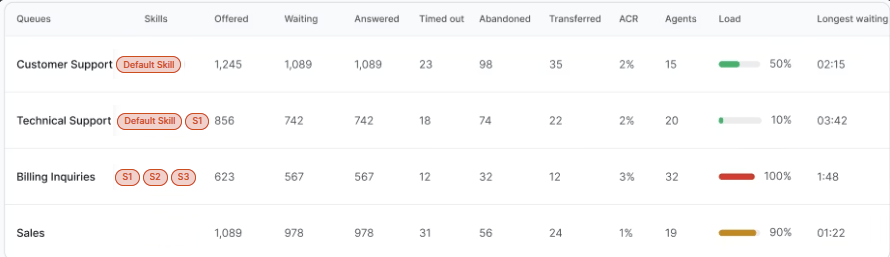
Queue-Skill Combinations Table
The Queue-Skill table breaks down abandoned conversation counts by the combination of queue and skill that was active at the moment each conversation entered the queue.
How rows are assigned
Each row in the table represents a unique Queue + Skill pair. A conversation is counted against a queue-skill row based on the skill it carried at the time it entered that queue, not the skill associated with it at the end of the call.
If a conversation moves through multiple queues and its skill changes between queues, each queue counts it for the skill it held at entry into that specific queue. The same conversation can appear in multiple rows if it passed through multiple queues with different skills.
Example:
Conversations with no skill
If a conversation enters a queue with no skill assigned, it appears in the table as a separate row with the queue name and a blank skill value.
Blank-skill rows display only when skill-less conversations exist for that queue. If no such conversations exist, the row is omitted.
If the scroll text toggle is enabled, the configured text scrolls at the bottom of the page at the selected speed.
