

Key Features
- Detailed Analytics: Understand user behavior and spot common query patterns.
- Answer Feedback: Collect and analyze feedback to assess the quality of your responses.
- Debugging: Use insights to troubleshoot problems and improve application performance.
- Continuous Improvement: Identify areas for enhancement to ensure more accurate and relevant responses.
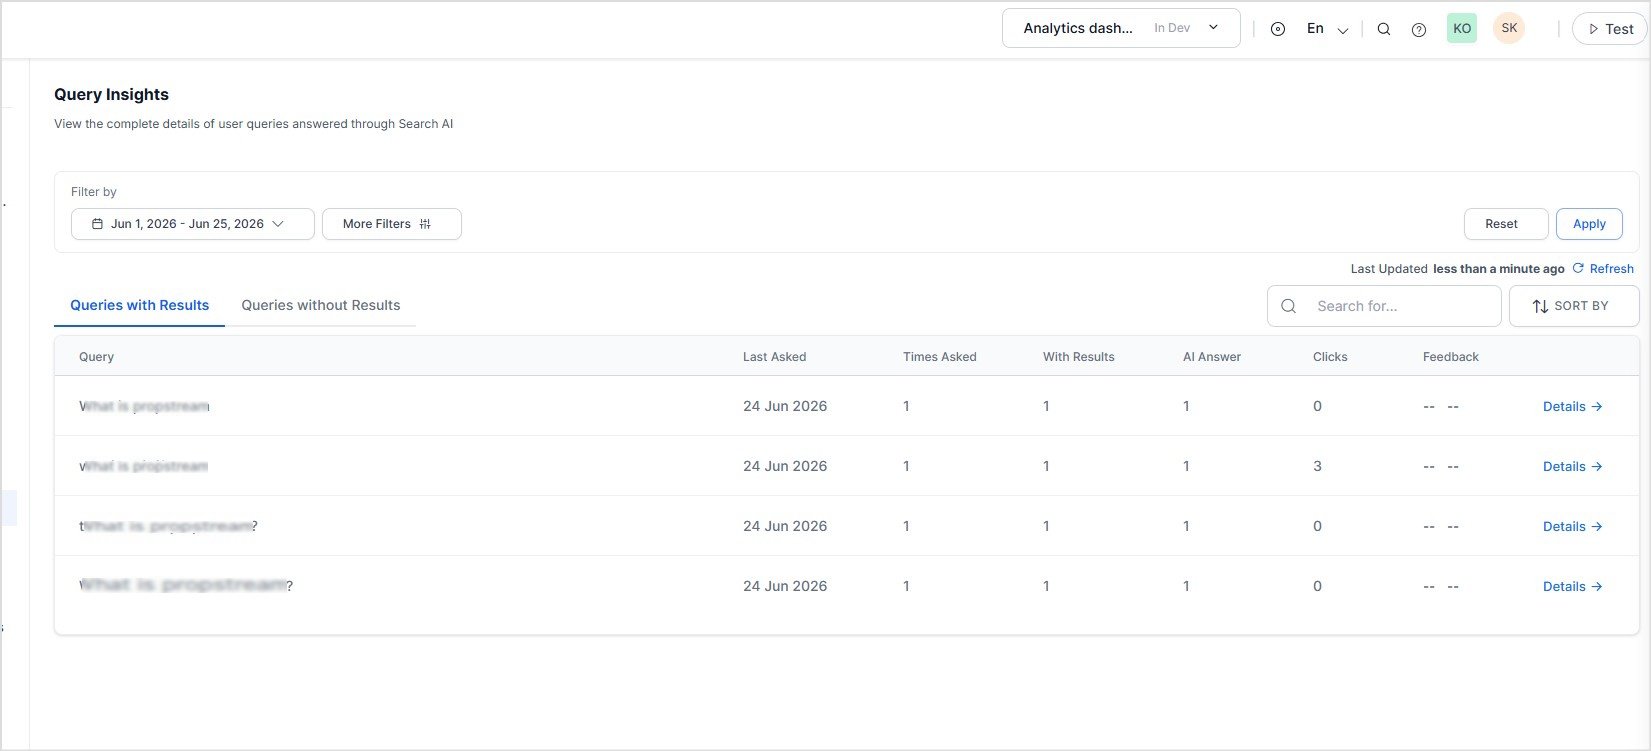
Query Overview
The dashboard displays all user queries for the selected time period. You can switch between:- Queries with Results: Displays queries that returned one or more search results.
- Queries without Results: Displays queries that did not return any search results.
Use these metrics to identify popular searches, monitor answer coverage, and evaluate user engagement.
Filtering and Sorting
Filter Queries
Use the filters at the top of the page to narrow the displayed results. Using Time Range: Select a predefined time range, such as Last 24 Hours, or choose a custom date range. Using More Filters: Select More Filters to filter analytics by:- Interaction Type
- Channels
- Custom Analytics Metadata
analyticsMetadata field of the Advanced Search API request.
For each metadata filter, specify:
- Field: Select the metadata key.
- Operator: Select the comparison operator.
- Value(s): Enter one or more values.
Custom Analytics Metadata filters are available only for search requests that include the
analyticsMetadata field.Search and Sort Queries
Use the controls above the query list to quickly locate and organize query records.- Search: Find specific queries using keywords.
- Sort By: Sort queries based on available metrics, such as query frequency or recency.