Documentation Index
Fetch the complete documentation index at: https://koreai.mintlify.app/llms.txt
Use this file to discover all available pages before exploring further.
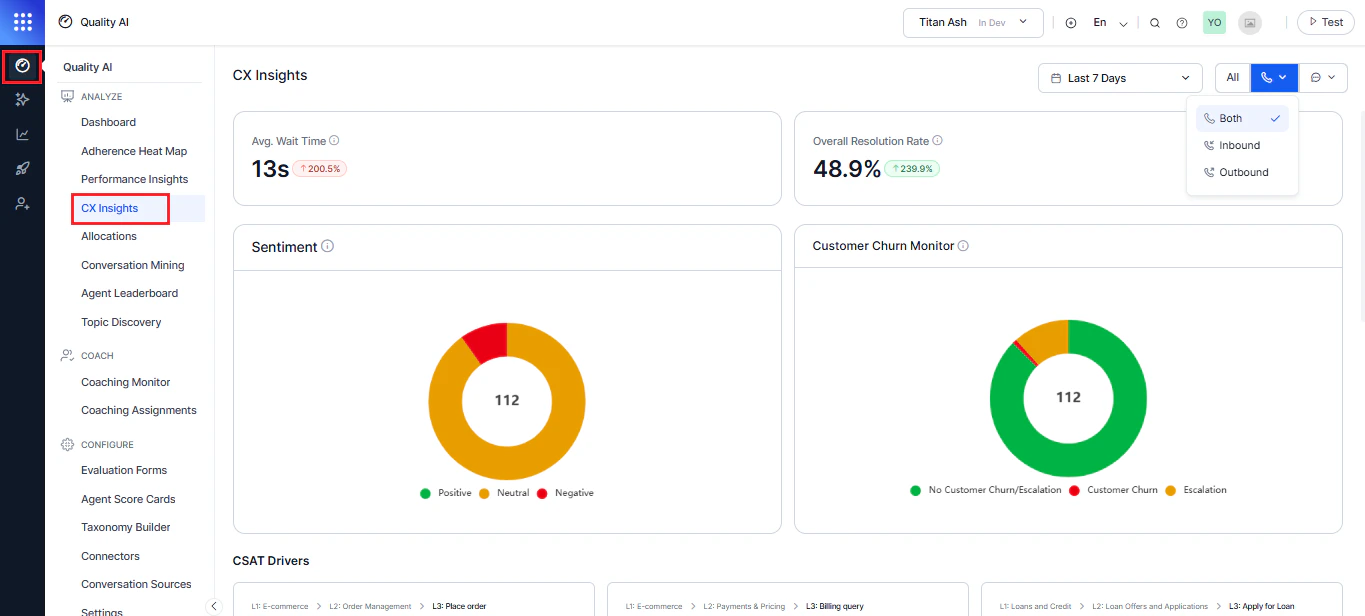
Customer Experience (CX) Insights provides a unified post-interaction view of customer experience across conversations, queues, channels, and contact directions.
It helps supervisors, QA managers, and CX leaders analyze customer satisfaction, sentiment, resolution outcomes, churn risk, and satisfaction drivers using real conversation data.
The dashboard supports direction-aware analysis through the Channel filter. When you select Inbound, Outbound, or Both, all widgets and visualizations update to show only matching interactions.
Enable the Conversational Intelligence toggle under Configure > Settings to access CX Insights and CX trends.
Why Use CX Insights?
| Use Case | How CX Insights Helps |
|---|
| Experience Monitoring | Tracks resolution, wait time, and customer sentiment trends. |
| Risk Detection | Identifies churn risk and escalation patterns early. |
| Satisfaction Drivers | Highlights topics that improve or reduce customer satisfaction. |
| Issue Prioritization | Helps teams focus on high-impact customer pain points. |
| Directional Analysis | Separately analyzes inbound and outbound experiences. |
Dashboard Sections
| Section | What it shows |
|---|
| CX Metrics | Average Wait Time, Resolution Rate, Sentiment, Churn Monitor. |
| CSAT Drivers | Topics positively influencing satisfaction. |
| DSAT Drivers | Topics negatively affecting customer experience. |
| Insights Mining | Topic clusters, keywords, and emotion trends. |
| Interaction Details | Conversation-level records and metadata. |
Filters
Date Range
Filter CX Insights data by date range (for example, Last 90 Days, Last 28 Days, Last 7 Days). The default is Today. Select a range and select Apply.
Channel and Direction
Filter CX data by channel and interaction direction.
Available direction options:
| Option | Description |
|---|
| Both | Shows inbound and outbound conversations |
| Inbound | Shows customer-initiated interactions only |
| Outbound | Shows agent-initiated interactions only |
Top-Level CX Metrics
These widgets provide a high-level view of service quality and customer experience.
To see which agents or behaviors influence CX outcomes, refer to Performance Insights.
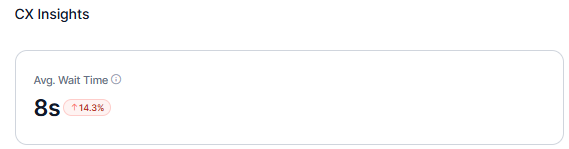
Average Wait Time
Displays the average time customers wait before an agent responds.
Calculation:
Calculated as total wait time ÷ customers served in the period. Defaults to 0 when no data is available.
Shows:
- monitor responsiveness
- identify staffing issues
- optimize queue performance
Use to: Monitor responsiveness and identify staffing or queue optimization needs.
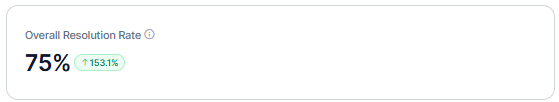
Overall Resolution Rate
Shows the percentage of interactions marked as resolved in the selected period. Displays 0% when no qualifying conversations exist.
Shows:
- track resolution effectiveness
- benchmark service quality
- measure process improvements
Use to: Track end-to-end resolution effectiveness, measure impact of process improvements, and set benchmarks.
Sentiment and Churn
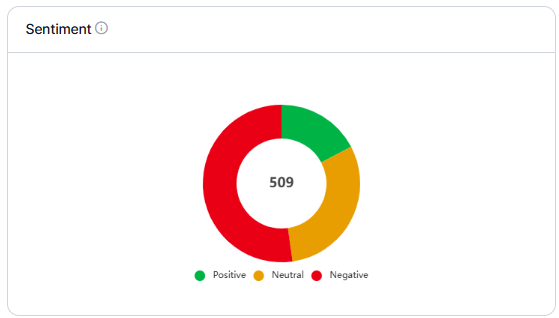
Sentiment Distribution
Shows the distribution of customer sentiment across all analyzed interactions.
The doughnut chart classifies conversations as:
| Color | Sentiment |
|---|
| Green | Positive |
| Yellow | Neutral |
| Red | Negative |
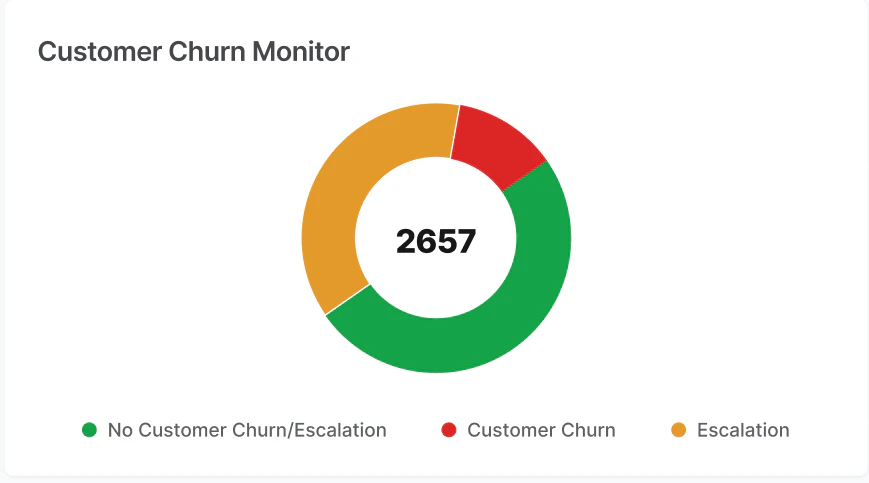
Customer Churn Monitor
Shows churn risk in a pie chart, comparing the churn percentage with total calls and escalations.
| Category | Color | Description |
|---|
| No Churn or Escalation | Green | Interactions with no customer churn or escalation. |
| Customer Churn | Red | Interactions where customer churn risk detected. |
| Escalation | Yellow | Interactions where Supervisor escalation requested. |
Process conversations after enabling Conversational Intelligence in Configuration > Settings to populate churn insights.
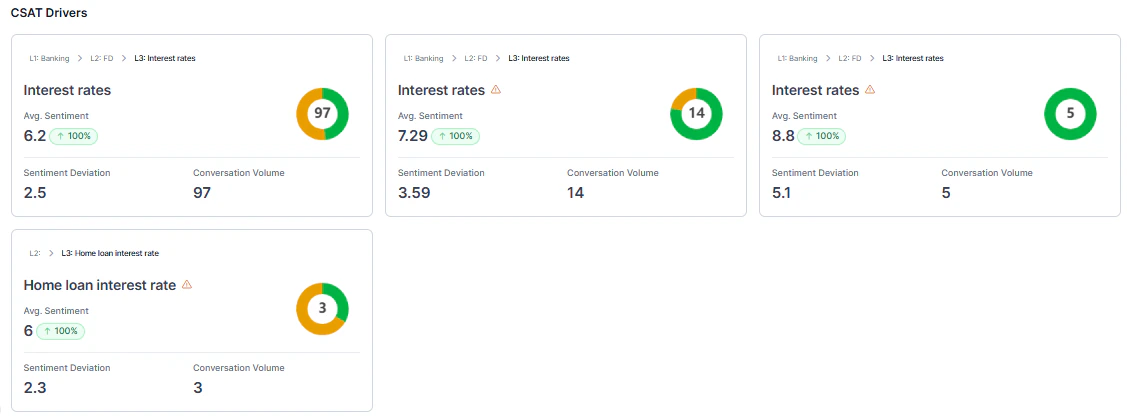
CSAT Drivers
CSAT Drivers identify topics that positively influence customer satisfaction.
The system uses a driver impact scoring model based on sentiment and topic volume.
 Driver Impact Score = (Average Sentiment − Baseline Sentiment) × Conversation Count
| Component | Description |
|---|
| Average Sentiment | Mean sentiment score (1-10) for the topic. |
| Baseline Sentiment | Overall sentiment average for the selected filters. |
| Conversation Volume | Number of interactions tagged with the topic. |
Qualification Criteria
A topic qualifies as a CSAT driver only when it meets both:
- Volume: ≥30 conversations and ≥2% of total conversations.
- Deviation: ≥0.8 sentiment points from baseline.
Driver Card Details
Each card shows:
- Topic name with taxonomy path (for example, L2: Travel Planning > L3: Cost of the Flights).
- Average sentiment score with comparison indicator.
- Color-coded sentiment badge.
- Sentiment deviation from baseline.
- Conversation volume.
Warning Indicators
Topics that don’t meet qualification thresholds display a warning appears.
| Warning Type | Meaning |
|---|
| Volume Warning | Insufficient data for reliable insights. |
| Deviation Warning | Sentiment is close to baseline. |
| Both | Limited volume and low differentiation. |
- If 6+ qualified drivers exist: Show top 6 (no warnings).
- If fewer than 6 qualified drivers: Fill remaining slots with warning cards.
- If limited data: Show a warning message indicating insufficient data.
Baseline Calculation
| Selection | Baseline |
|---|
| Multiple or all channels | Overall filtered sentiment average. |
| Single channel | Channel-specific sentiment average. |
- When Conversational Intelligence or Generative AI is disabled, advanced CX insights aren’t available.
- To enable: Navigate to Generative AI Tools > Gen AI Feature > Copilot.
DSAT Drivers
DSAT Drivers identify topics that negatively impact customer satisfaction.
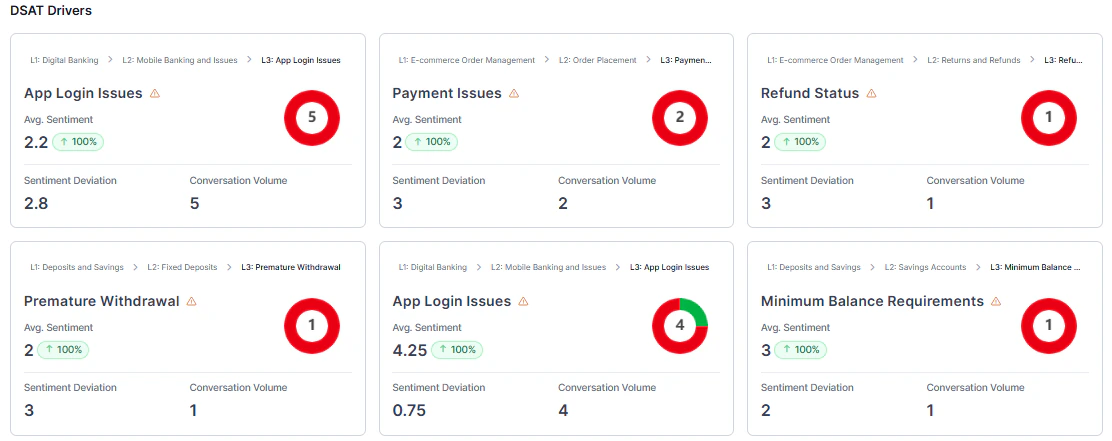 The system uses the same scoring model as CSAT Drivers but surfaces topics with sentiment below baseline.
Visual indicators:
The system uses the same scoring model as CSAT Drivers but surfaces topics with sentiment below baseline.
Visual indicators:
- Red sentiment badges.
- Warning icons when data thresholds aren’t met.
Use to: Identify customer pain points, prioritize high-impact fixes, and track improvements after corrective actions.
If insufficient data is available, the system displays an empty or warning state.
Data Handling Rules
CX Insights excludes the following interactions from all aggregated metrics:
- Below Threshold
- Duration Unavailable
Manually evaluated conversations remain included.
Excluded interactions do not affect:
- totals
- averages
- distributions
- driver calculations
