Documentation Index
Fetch the complete documentation index at: https://koreai.mintlify.app/llms.txt
Use this file to discover all available pages before exploring further.
Notifications display policy violations and system anomalies detected by the Agent Management Platform’s governance system. When an active policy evaluates an agent’s behavior and detects a violation, the platform creates a notification that includes the severity level, the triggering criteria, and the session that caused it.
Use the Notifications page to monitor governance activity across your projects, prioritize high-severity issues, and investigate violations as they occur.
You are notified of new notifications via email or the in-app bell icon.
Why Notifications Matter
| Benefit | Description |
|---|
| Triage | Helps teams prioritize the most severe or time-sensitive issues. |
| Faster Response | Reduces the time to detect and resolve model or agent misbehavior. |
| Accountability | Records who viewed, acknowledged, or resolved each incident. |
Key Capabilities
| Capability | Description |
|---|
| Severity Filtering | Isolate Critical or High issues to focus on the most urgent violations. |
| Visual Indicators | Color-coded severity badges and read/unread markers for quick scanning. |
| Detailed Drill-Down | One-click access to the full execution trace for root-cause analysis. |
| Multi-Channel Notifications | Supports in-app and email notifications. |
Core Terminology
| Term | Definition |
|---|
| Incident | A specific occurrence of a policy violation. |
| Metric Pill | A badge that shows the value or score that caused the violation—for example, Toxicity: 0.95. |
| State | The notification’s lifecycle status: Unread → Read. |
Notification Statistics
The Notifications page includes summary metrics that help you quickly assess governance posture.
| Metric | Description |
|---|
| Total Notifications | Total notifications generated in the last 24 hours (Read + Unread). |
| Critical | Number of critical-severity violations in the last 24 hours. |
| Unread | Notifications awaiting review. |
| Top Violation | The most frequently triggered policy in the last 24 hours. |

Review Critical and High-severity items first to ensure urgent issues are resolved promptly.
Managing Notifications
Notifications require explicit acknowledgment. A notification stays in your inbox until you mark it as Read, ensuring each violation is reviewed before it is cleared.
Acknowledge Notifications
After reviewing a notification, mark it as Read to keep your inbox current. You can update items individually or select multiple notifications to acknowledge them at once.
Prioritize and Filter
Use sorting and filters to focus on the notifications that matter most.
| Filter | Description |
|---|
| Severity | Show only Critical, High, Medium, or Low violations. |
| Status | Filter by Read, Unread, or Resolved. |
| Policy | Narrow results to a specific policy. |
| Timeframe | Limit results to a defined date range. |
| Project | Available in workspace-level views only. |
In a workspace-level view, the Project filter is available to display violations from specific projects. In a project-level view, the filter is applied automatically for the current project and the project selector does not appear.
Viewing Notification Details
Use this procedure to open and review the details for any notification.
Prerequisite: You must have access to the project where the notification was generated.
- Open the Notifications page.
- Identify a notification to review. Critical alerts are visually highlighted for quick scanning.
- Select the notification or choose View Details.
- Review the details in the notification panel, including the triggered policy, the session involved, and the condition that caused the violation.
- Take action:
- Mark the alert as Read, or
- Select the Session ID in the Context tab to open the session in Observability → Runs to view the full execution trace for deeper investigation.
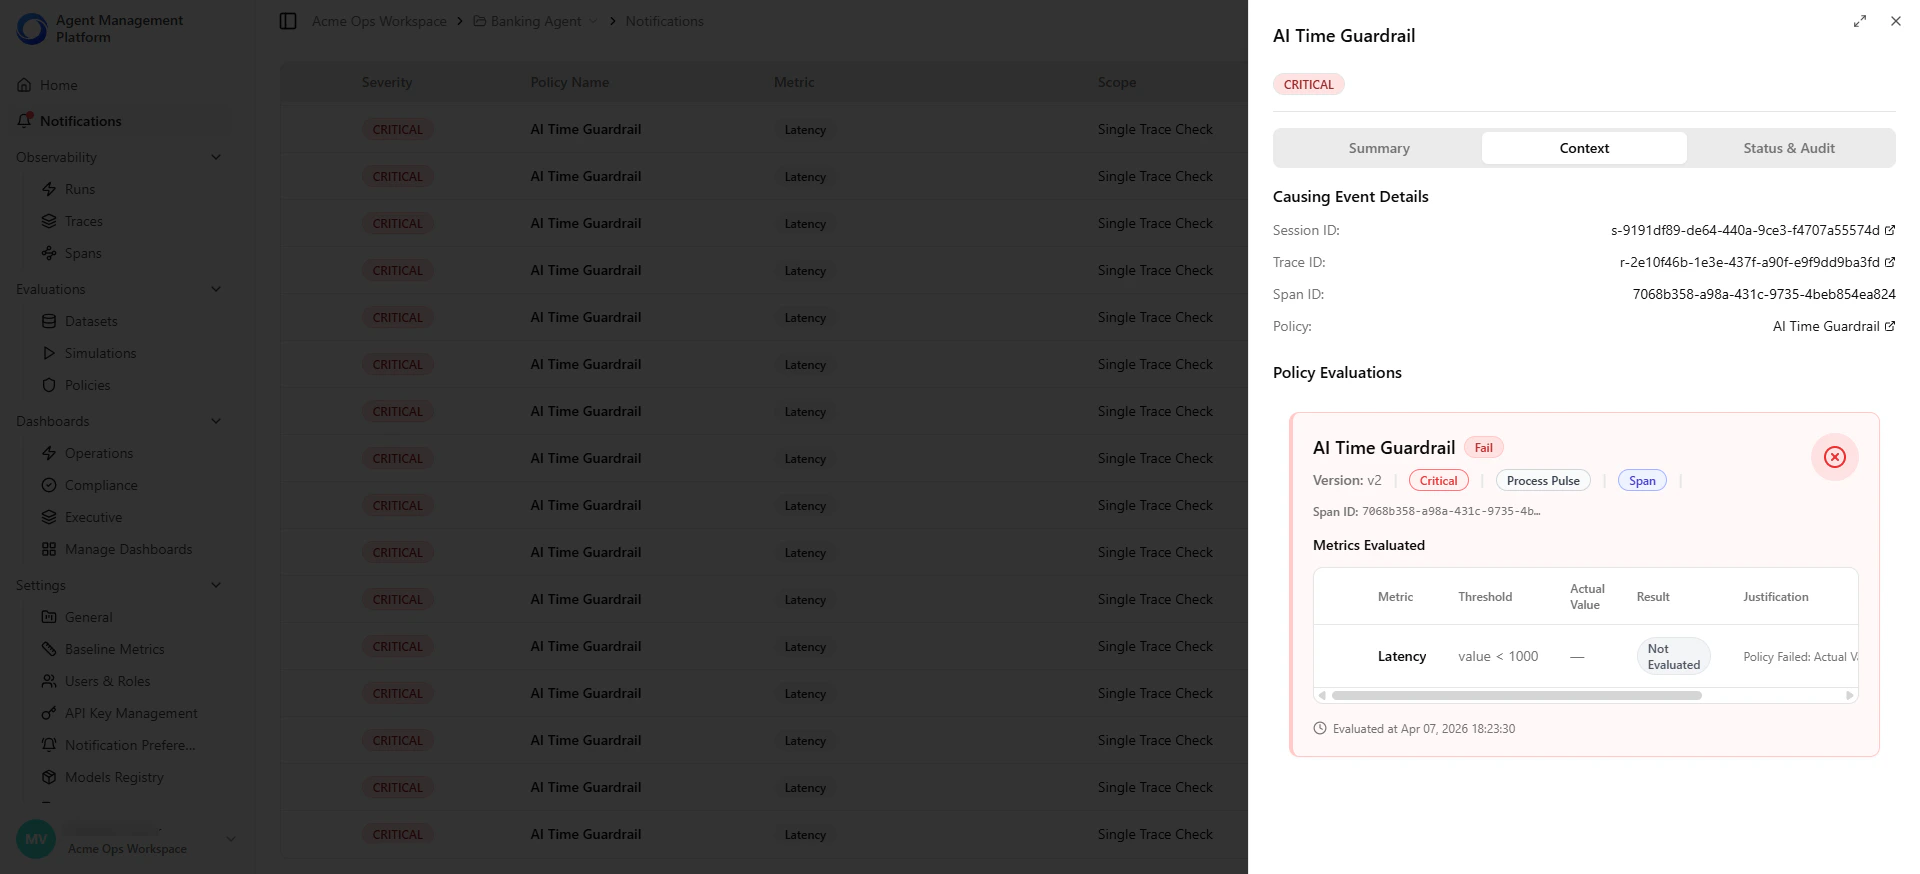
Notification Details Panel
When you open a notification, a detail panel appears on the right with three tabs.
| Tab | Purpose | What to Review |
|---|
| Summary | Confirm the violation at a glance. | Which rule was violated, which policy generated the alert, and when the event occurred. |
| Context | Verify the exact conditions that caused the violation. | The session and event that triggered the violation, the associated policy, and a direct link to investigate the session in Runs. |
| Status & Audit | Track follow-up actions and support compliance review. | When the notification was generated, when it was marked as Read, and any additional status updates. |

Investigating Policy Violations
When deeper analysis is needed, use the Context tab to open the related session in Observability → Runs, where you can review the complete execution trace—including LLM calls, tool usage, and timing data.
- In the Context tab of the selected notification, select the Session ID to view the full execution trace.
- The system opens the corresponding session in Observability → Runs.
- Review the spans and events that contributed to the violation.
- Determine whether the behavior was expected, caused by an edge case, or the result of incorrect configuration.
- Make any required updates, such as adjusting thresholds or modifying agent logic.