

View the Conversations Dashboard
- Click Analytics on the left navigation pane. The Analytics panel displays the list of reports.
- Click Conversations Dashboard under the Overview section of the Analytics panel. The Conversations Dashboard appears on the right side of the page.
- Select the appropriate filters and click Apply.
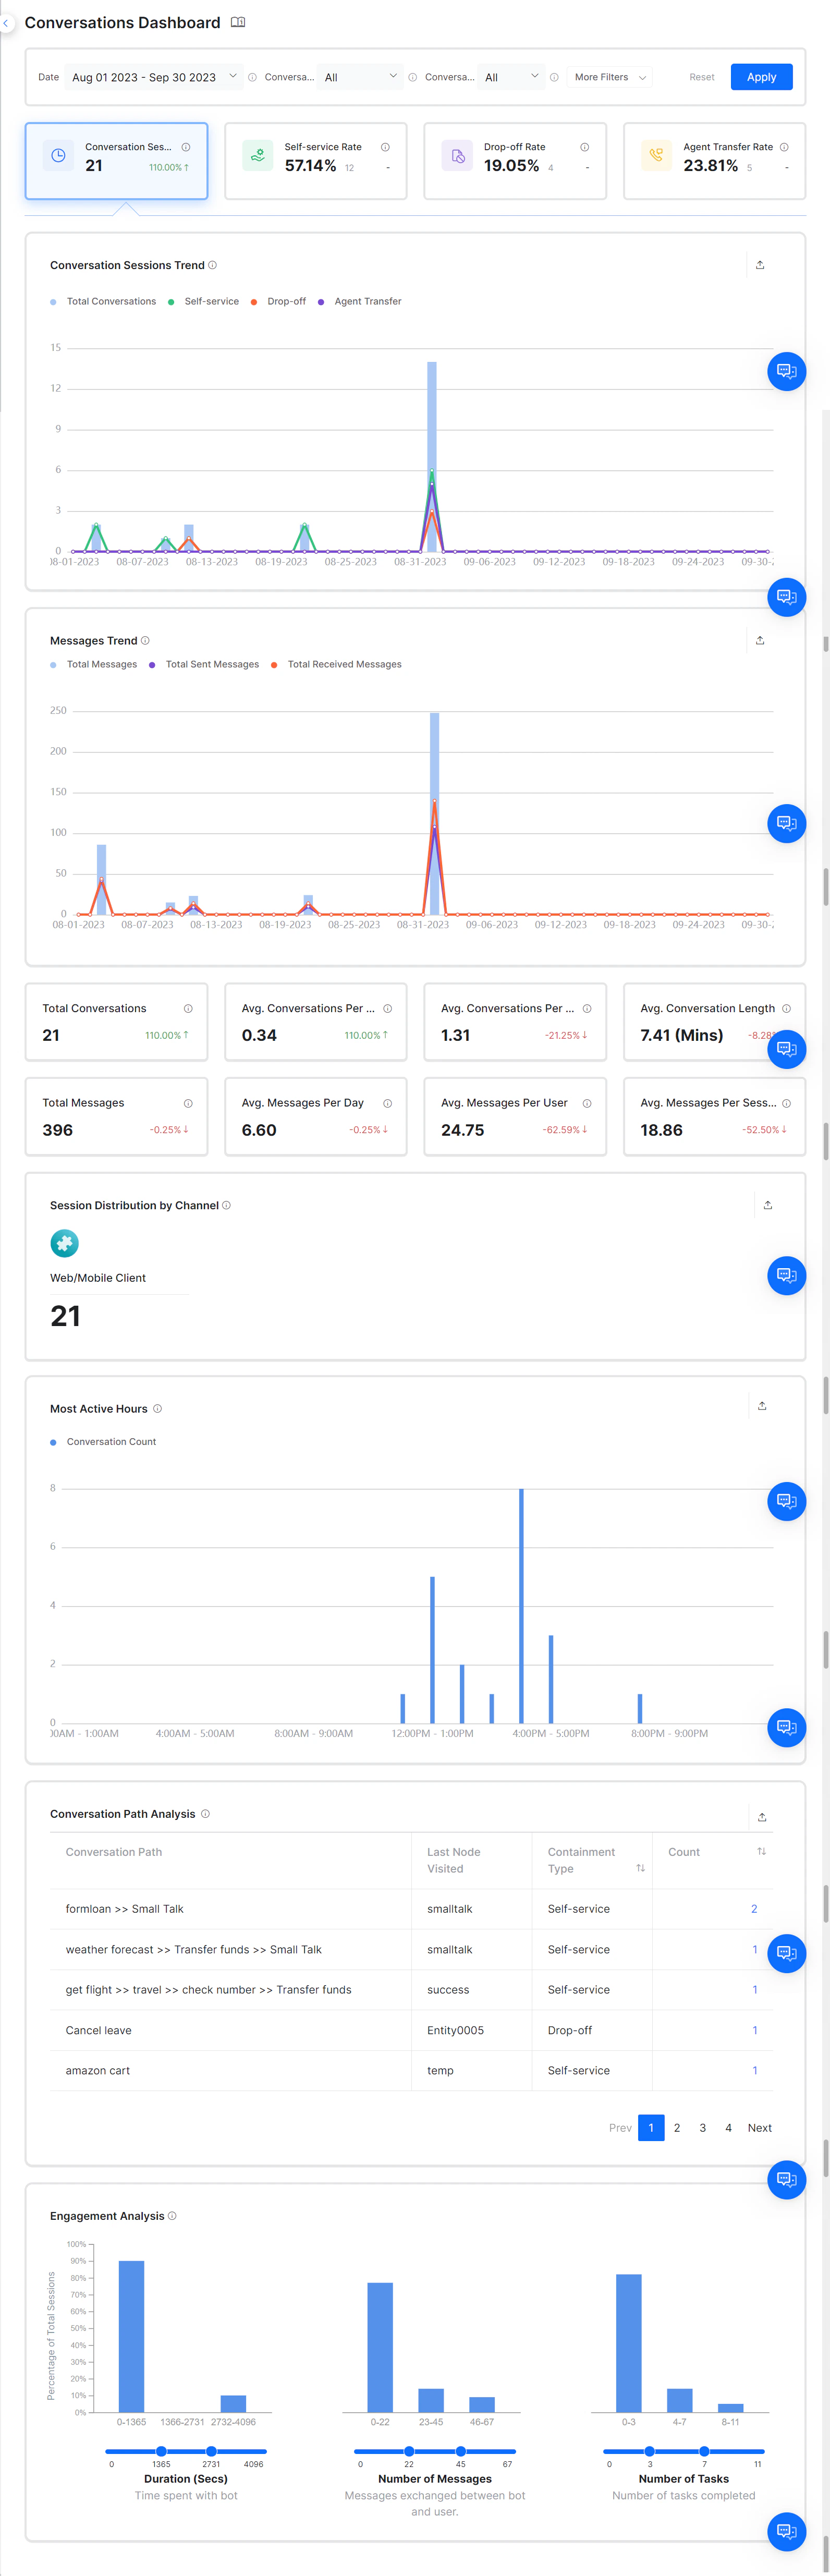
Conversation Sessions
Conversation Sessions display the total number of conversations between the AI Agent and a user in a specific time period. A session starts when a user sends a message and ends when the user indicates the problem is solved, abandons the chat, or reaches an agent transfer node.Self-service Rate
Self-service sessions are conversations that the AI Agent successfully contains. The Self-service Rate widget displays the percentage and total number of self-service conversations, along with the percentage increase or decrease compared to the previous period. If a dialog task reaches the End Of Dialog node, the task is considered complete and categorized as self-service. If an AI Agent is configured with a Welcome event or On-Connect event, and the AI Agent sends multiple messages without any user interaction, the platform counts this as a contained session and increases the self-service count.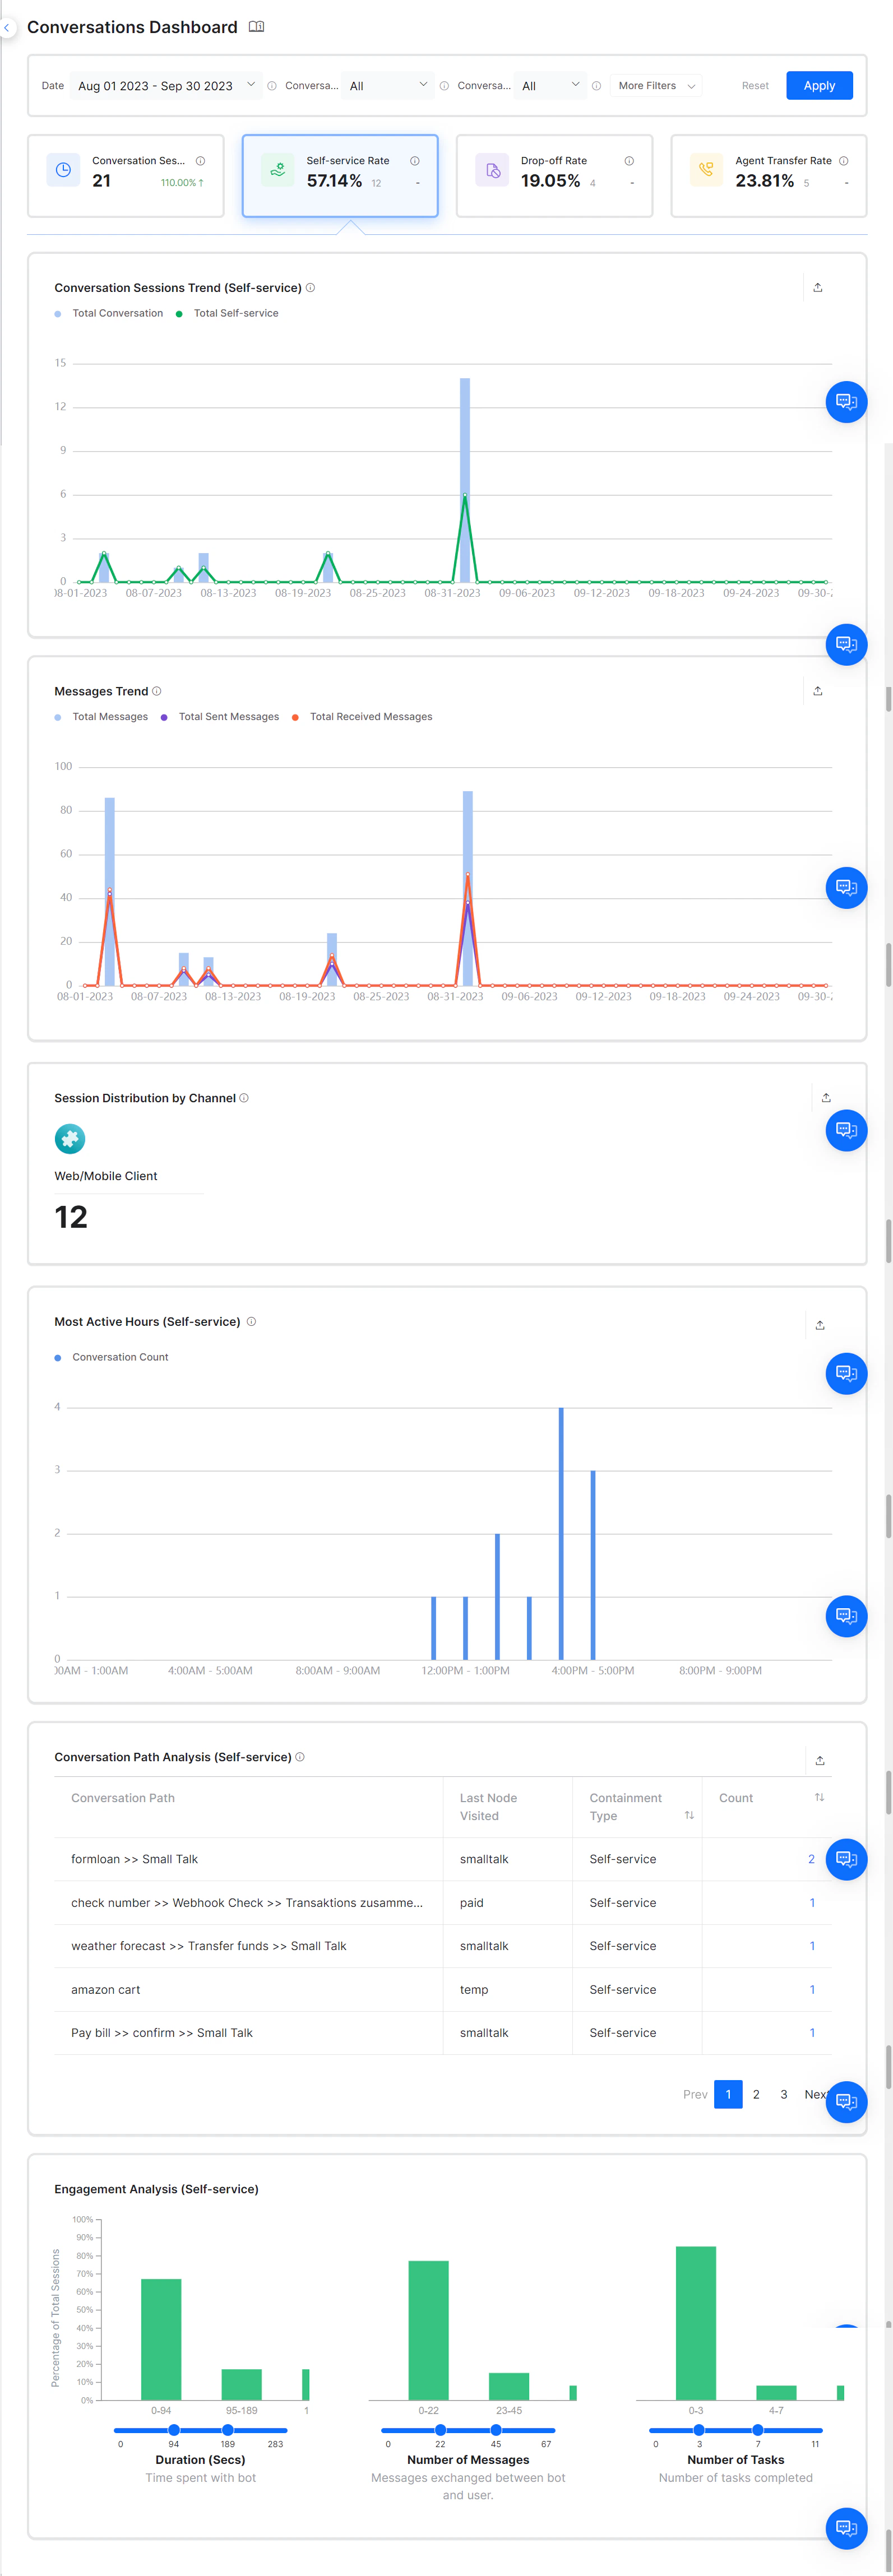
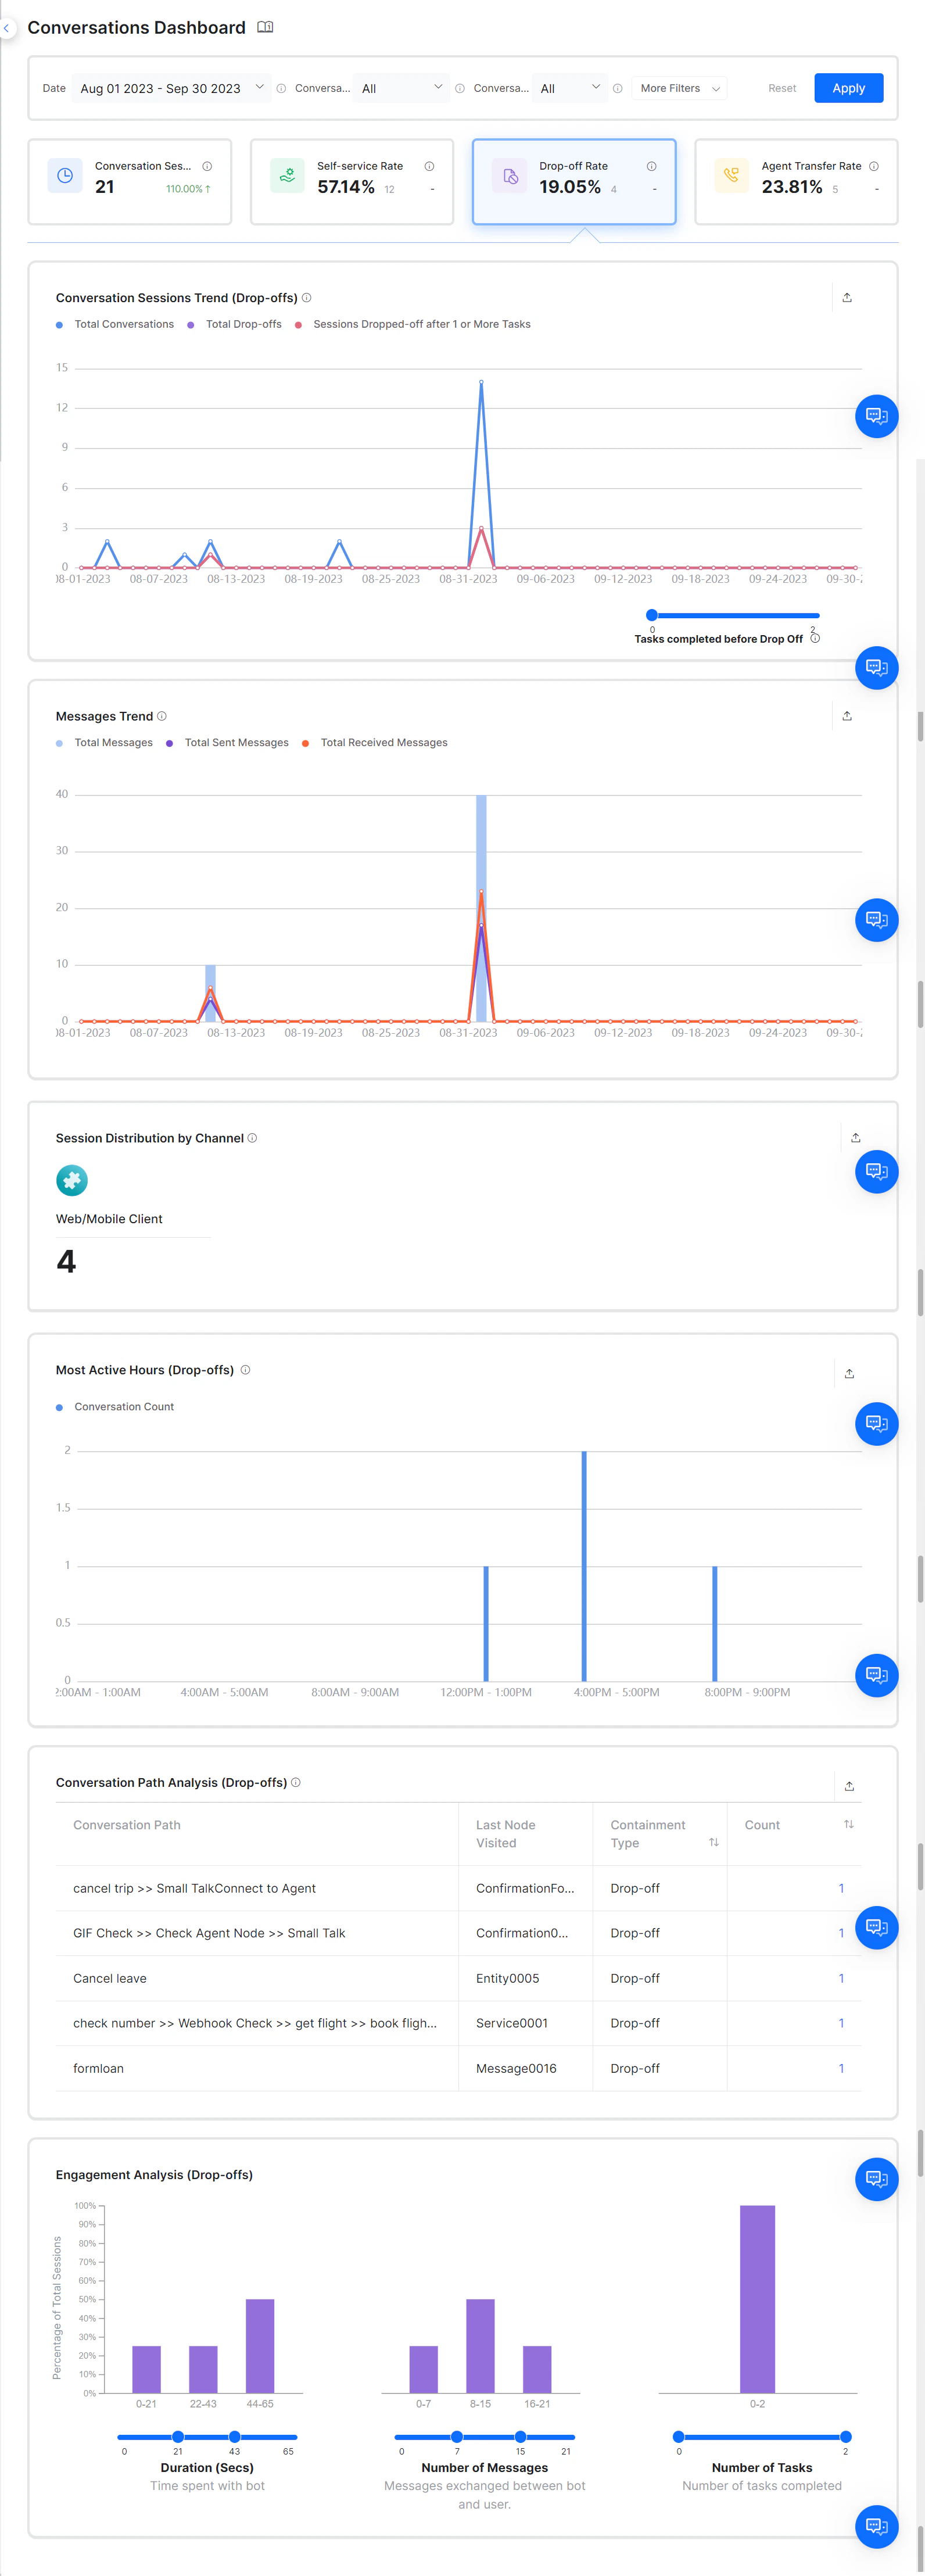
Drop-off Rate
A drop-off is a conversation where the user abandons the session without completing a task. Drop-offs occur in the following scenarios:- A user left the conversation midway without completing any task.
- The task ended as a failure.
- The last interaction resulted in an “intent not identified” scenario.
- No response from the AI Agent.
- The user abandoned the AI Agent during a live conversation.
Agent Transfer Rate
When users can’t complete tasks using the AI Agent, the session is handed over to a human agent. When the dialog reaches the agent transfer node, the platform classifies the session as an Agent Transfer session. The Agent Transfer Rate widget displays the percentage and total number of agent transfers within the selected period, along with the percentage increase or decrease from the previous period.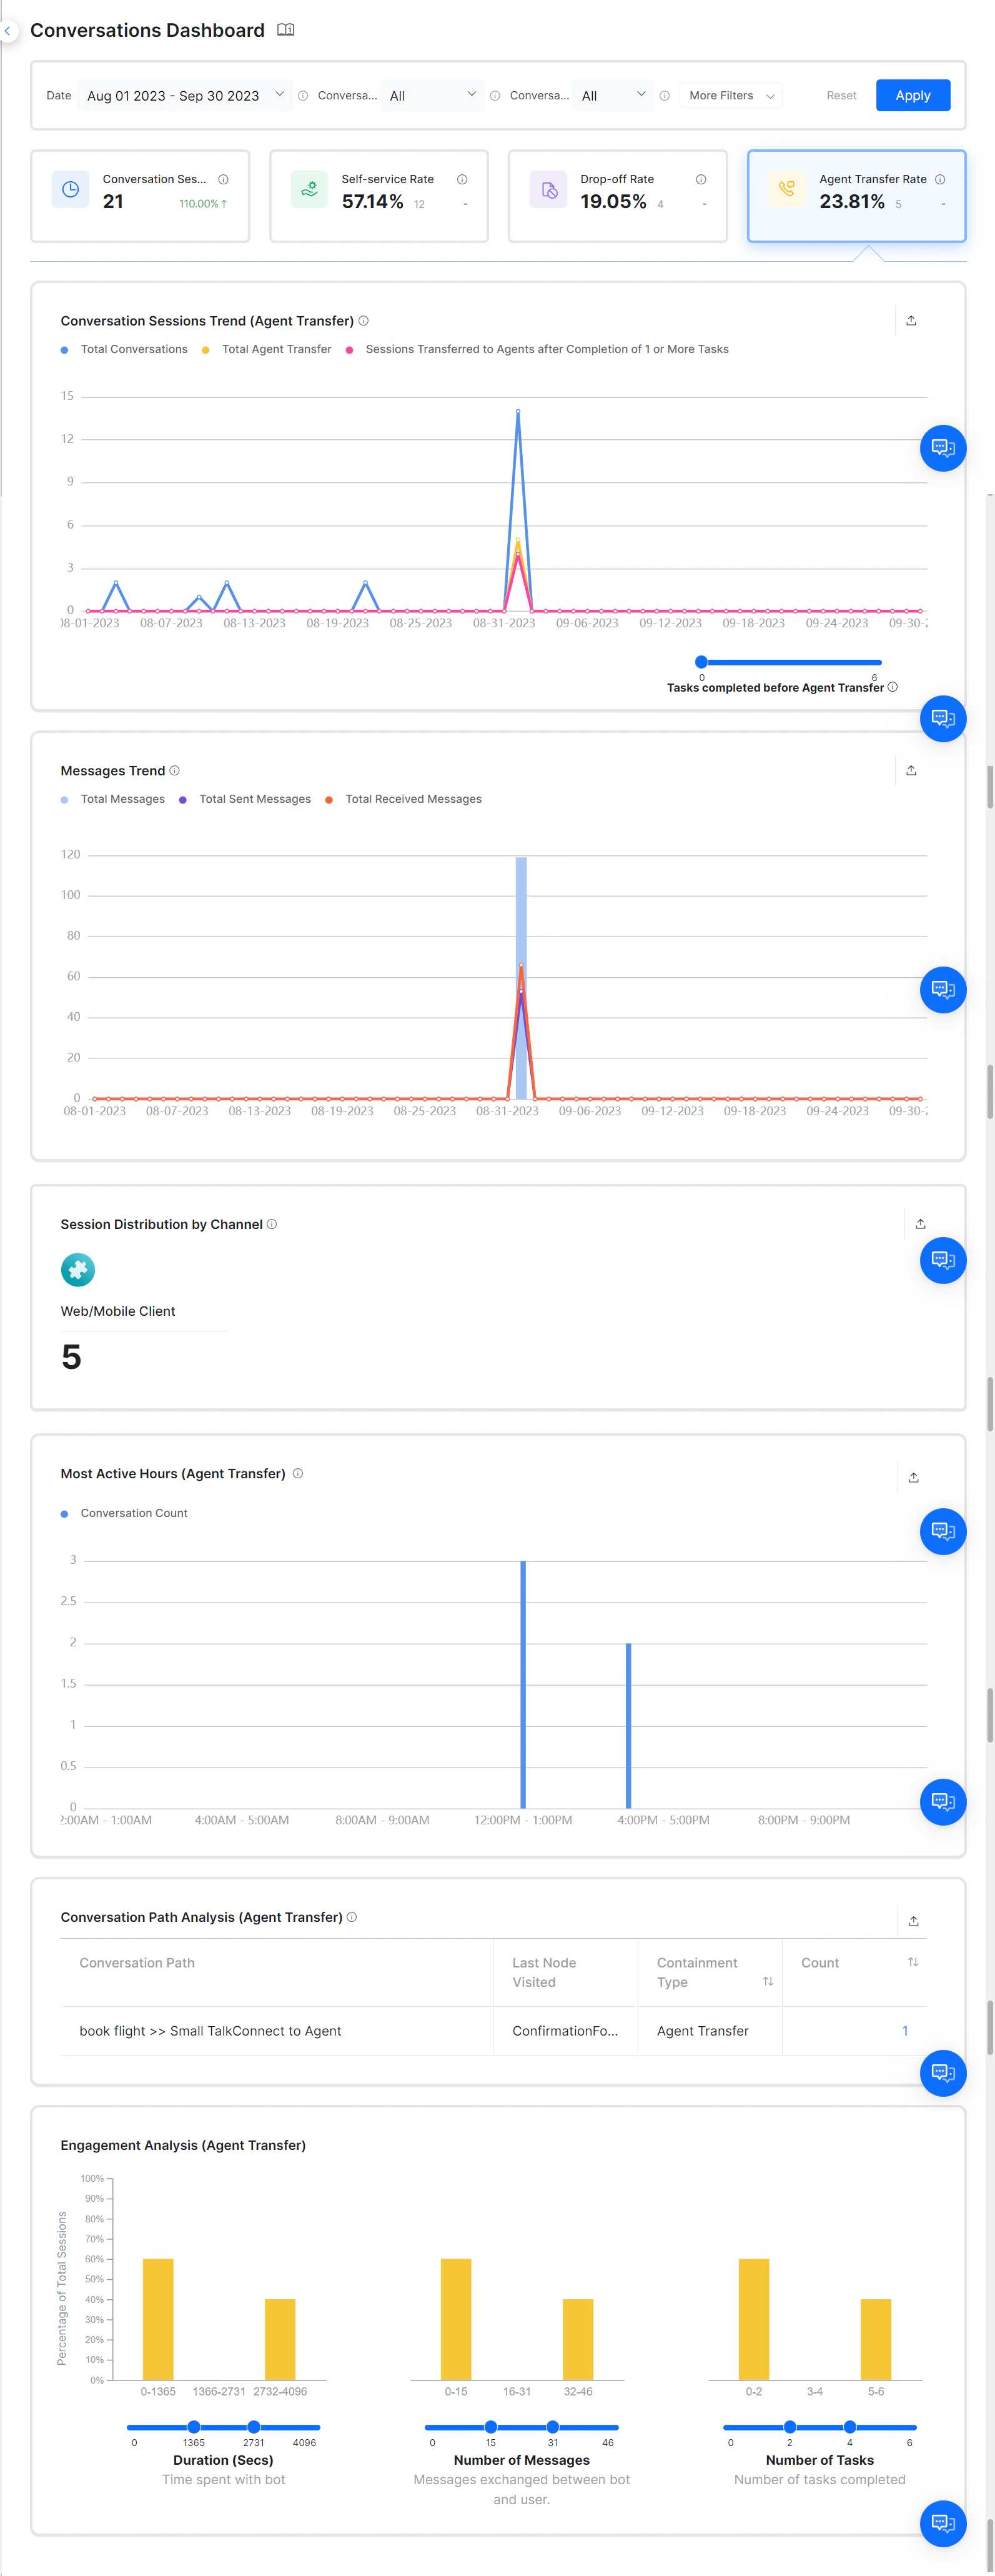
Unblu and IVR channels don’t require an Agent Transfer node to transfer conversations to agents.
Metrics Table
For trend line charts, if the period is 24 hours, the X-axis shows hourly intervals. Otherwise, it shows daily intervals. The Y-axis shows the total number of sessions.
| Metric | Description |
|---|---|
| Conversation Session Trend | A line chart showing conversation sessions over time. Displays total, self-service, drop-off, and agent transfer sessions. Agent hand-off scenarios include: customers transferred without completing any task (Total Agent Transfer), and customers transferred after completing one or more tasks (Sessions Transferred to Agents after Completion of 1 or More Tasks). |
| Message Trend | A line chart showing total messages sent by the AI Agent versus messages received. Available for Conversation Session only. |
| Session Distributed by Channel | Shows the number of sessions distributed across all channels in a timeframe. Available for Conversation Session only. |
| Most Active Hours | A bar chart showing the most active hours in a day based on number of conversations and messages. Broken down by self-service, drop-off, and agent transfer sessions. |
| Conversation Path Analysis | A table showing every unique conversation path between the AI Agent and users over a period. Shows the most popular path for Conversation Sessions, the path leading to self-service, path leading to drop-off, and path leading to agent transfer. |
| Engagement Analysis | An interactive bar chart for analyzing AI Agent engagement based on messages exchanged, conversation duration, and task completion. |
| Avg. Conversation per Day | A scorecard showing the average number of conversation sessions per day and comparison analysis. Formula: Total conversations / Number of days. Available for Conversation Session only. |
| Average Conversation Per User | A scorecard showing the average number of conversations per user. Formula: Total conversations / Total users. Available for Conversation Session only. |
| Average Conversation Length | A scorecard showing the average conversation duration in minutes. Formula: Total conversation length / Total conversations. For completed conversations: End timestamp - Start timestamp. For ongoing conversations: Dashboard Load timestamp - Start timestamp. Available for Conversation Session only. |
| Total Messages | A scorecard showing the total number of messages received from the user and sent by the AI Agent. Available for Conversation Session only. |
| Average Messages Per Session | A scorecard showing the average number of messages per session. Formula: Total messages / Total sessions. Available for Conversation Session only. |
Filter Criteria
The Conversations Dashboard data can be filtered using the available filter criteria. Learn more. The following table shows the applicability of custom tag types to different widget types.| Widget Type | Session Tags | User Tags | Message Tags |
|---|---|---|---|
| Successful Tasks | Applicable | Applicable | Not Applicable |
| Sessions | Applicable | Applicable | Not Applicable |
| Messages & Conversation Sessions | Applicable | Applicable | Applicable for Chats |
| Intent Recognized vs. Failed | Applicable | Applicable | Not Applicable |
| Top Tasks | Applicable | Applicable | Not Applicable |
| Top Channels | Applicable | Applicable | Not Applicable |
| Agent Transfer | Applicable | Applicable | Not Applicable |