- New users, existing users, and returning users of their app.
- Active users over a specific period.
- New and returning users on a specific day, week, or month.
- Total inactive users registered on the app.
- The percentage of users who return and use the app “N” days after starting.
View the Users Dashboard
-
Click Analytics on the left navigation pane. The Analytics panel displays the list of reports.
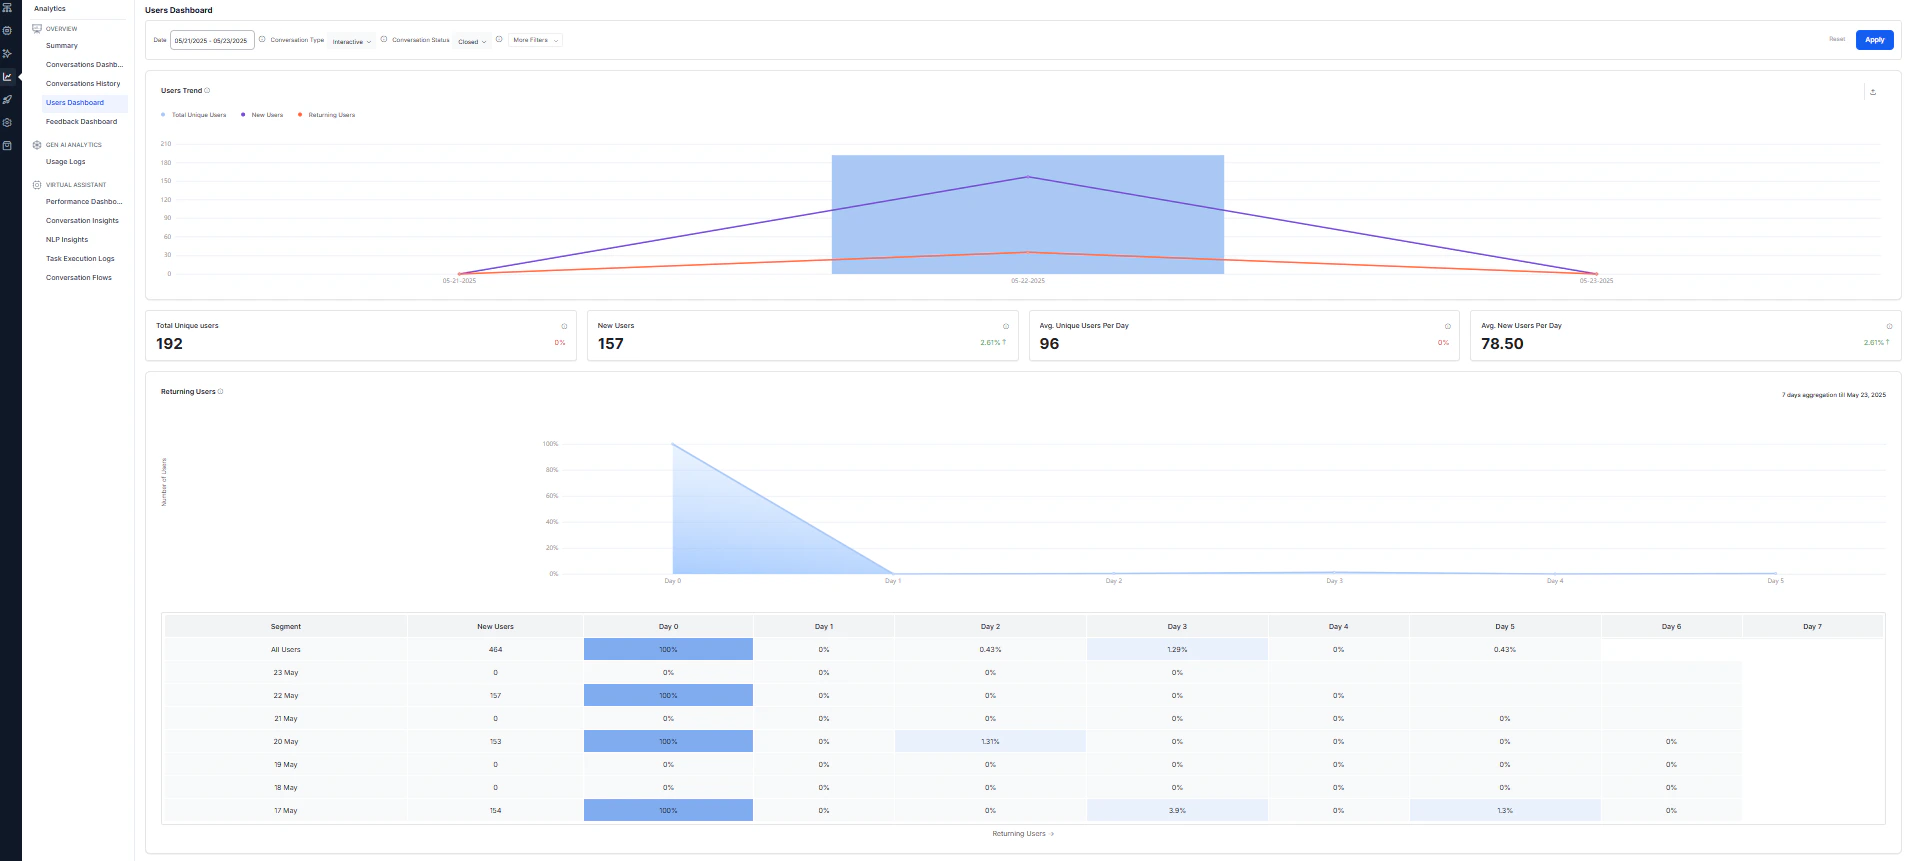
- Click Users Dashboard under the Overview section of the Analytics panel. The Users Dashboard appears on the right side of the page.
- Select the appropriate filters and click Apply.
User Trends Considerations
The following examples illustrate how users are classified:- User-A interacted for the first time on 25-Jan-2022. If the dashboard shows data from 23-Jan to 26-Jan-2022, User-A is a new user.
- User-B interacted for the first time on 25-Jan-2022 and again on 26-Jan-2022. For the same date range, User-B is a new user on 25-Jan and a returning user on 26-Jan.
- User-C interacted for the first time on 21-Jan-2022 and again on 26-Jan-2022. For the date range 23-Jan to 26-Jan-2022, User-C is a returning user since their first interaction falls outside the selected range. Learn more about New and Returning Users.
User Trend Metrics
The Users Dashboard provides insights on the following metrics:- Total Unique Users: Total number of unique users who interacted with the AI Agent.
- New Users: Total number of users interacting with the AI Agent for the first time in the selected period.
- Returning Users: Total number of users who previously interacted with the AI Agent and initiated another session in the selected period.
- Avg. Total Unique Users Per Day: Total unique users in the selected period divided by the number of days.
- Avg. New Users Per Day: Total new users in the selected period divided by the number of days.
Dashboard Components
Users Trend
The Users Trend shows the distribution of new users, returning users, and total unique users interacting with the AI Agent over a period. This helps determine user engagement for the selected period.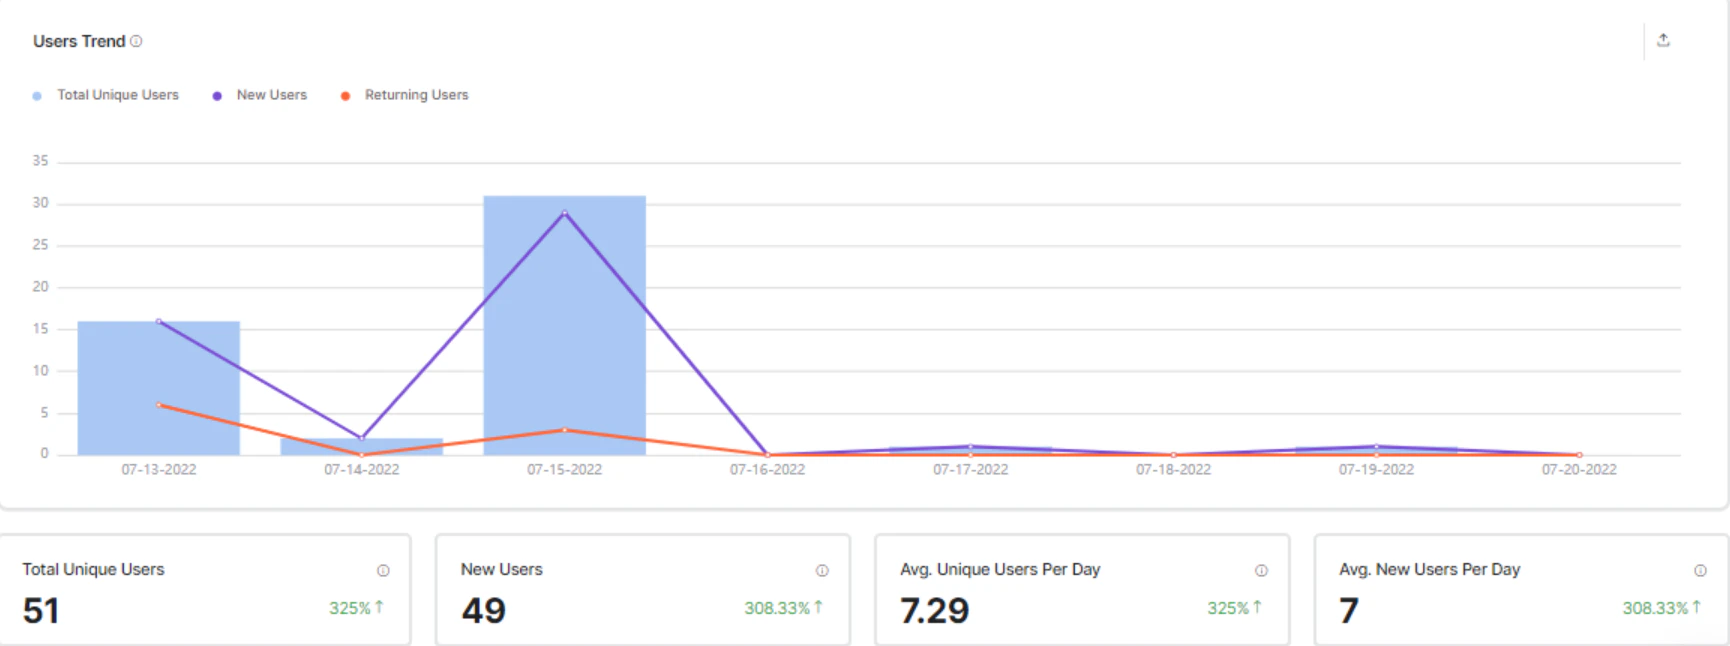
Returning Users
The Returning Users graph shows day-wise returning users (as a percentage) for the selected dates and filters. Day 0 is the first time a user interacts with the AI Agent. The returning users percentage is calculated for consecutive days in the selected period. For example, if users are at 100% on Day 0 (first interaction) and 0% on Day 1, it means none of the users who interacted on Day 0 returned the following day on the same channel or browser.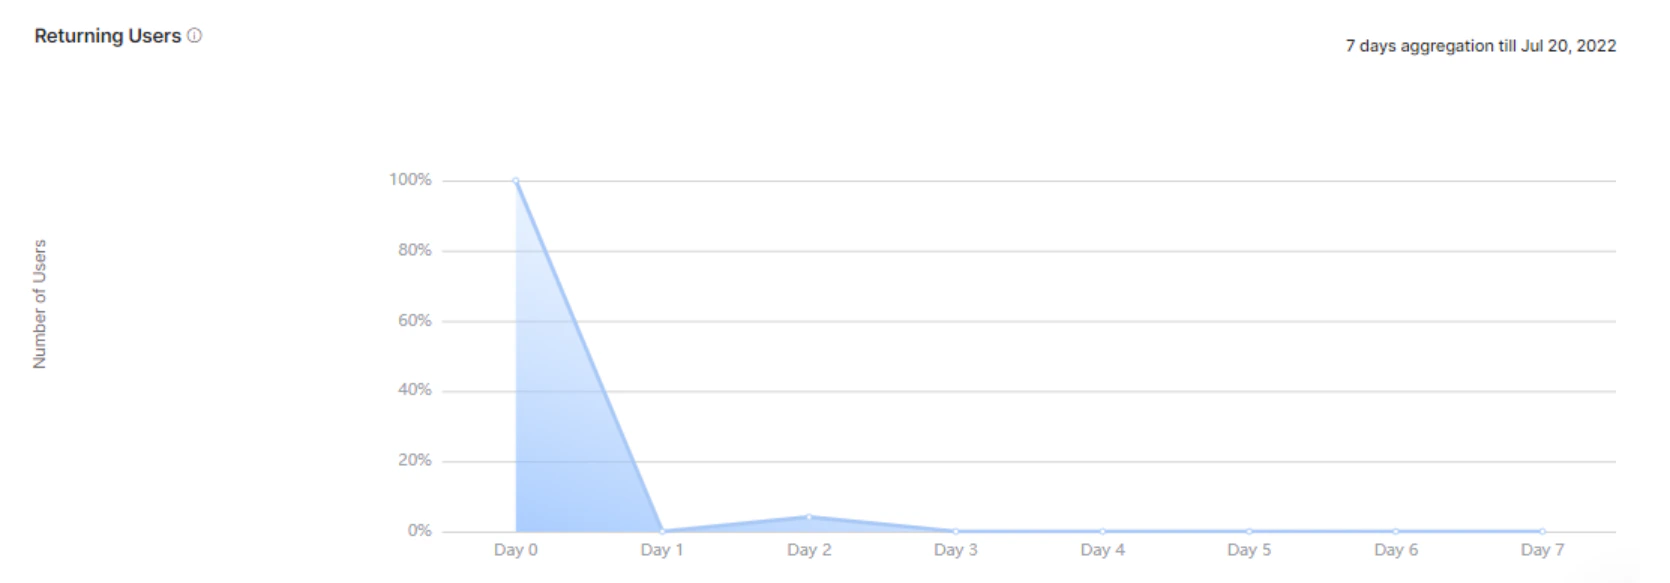
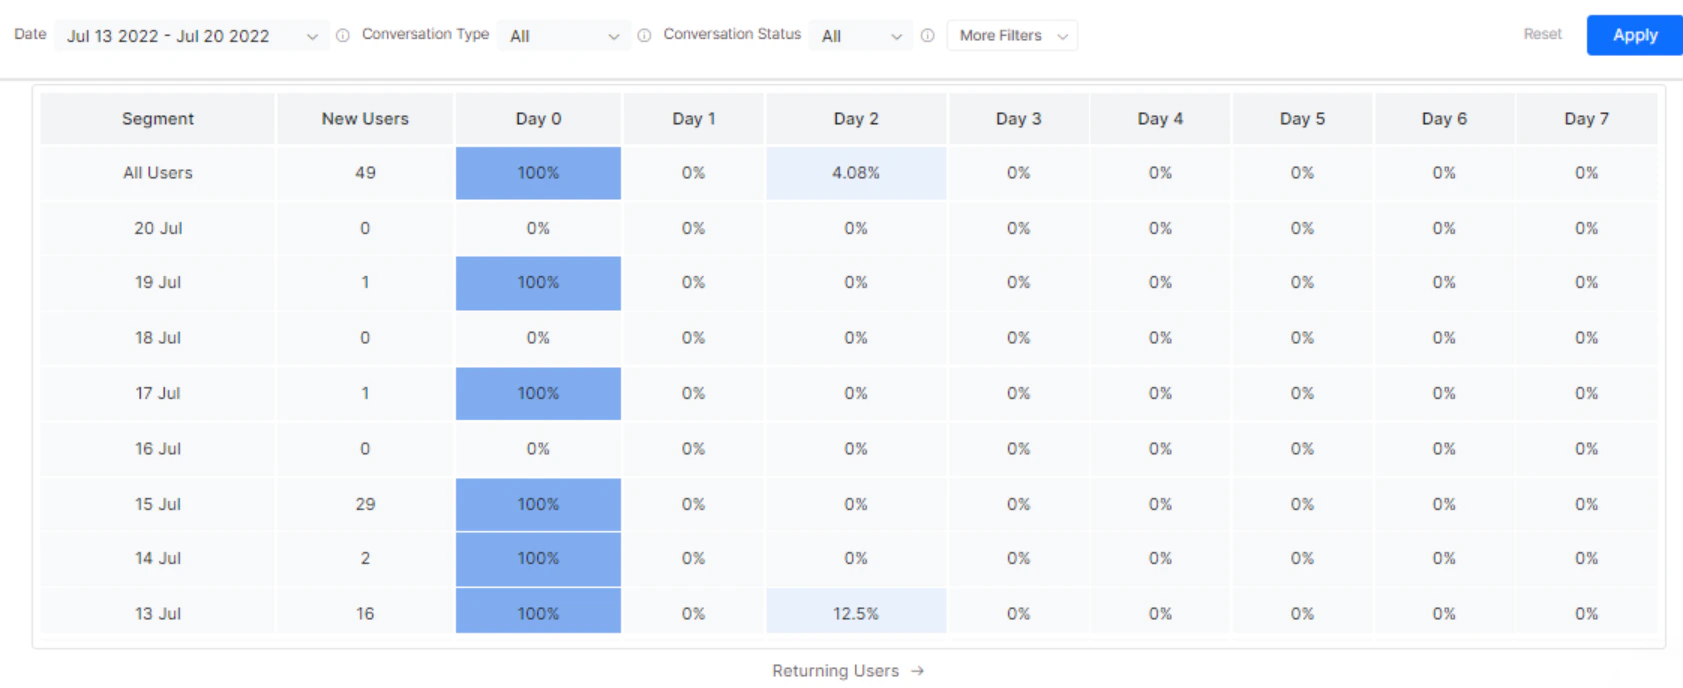
Cohort Analysis
The Cohort Analysis chart plots weekly new users and the percentage of returning users based on the formula(Returning Users / New Users) * 100 on consecutive days to determine the retention rate. The Users Dashboard displays Day N retention of daily, weekly, or monthly cohorts within a customizable date range.