
Policies define automated rules that govern AI agent behavior. They enable proactive monitoring by evaluating agent outputs against predefined standards—ensuring quality, compliance, and performance thresholds are met. Policies use the LLM-as-a-Judge framework, where a configured LLM model evaluates agent responses against structured criteria and generates pass/fail verdicts with detailed reasoning. Policies can be applied in real time (live) on incoming telemetry traffic to enforce guardrails, or in batch (on demand) for historical analysis. Both modes support preconfigured templates for common industry standards. These capabilities make policies the governance backbone of the platform—providing a unified mechanism to evaluate, flag, or block agent behaviors across all workflows.Documentation Index
Fetch the complete documentation index at: https://koreai.mintlify.app/llms.txt
Use this file to discover all available pages before exploring further.
Why Policies Matter
| Benefit | Description |
|---|---|
| Risk Mitigation | Prevents harmful, toxic, or non-compliant content from reaching end users. |
| Compliance | Ensures adherence to regulatory requirements such as GDPR and PII protection. |
| Quality Assurance | Enforces brand standards and maintains response quality. |
Common Policy Use Cases
| Use Case | Description |
|---|---|
| Safety | Detect toxic language, unsafe content, or jailbreak attempts in agent responses. |
| Accuracy | Flag hallucinated facts or incomplete answers using a custom LLM prompt. |
| Compliance | Ensure transcripts do not contain personal identifiers (PII) or other sensitive information. |
| Cost Guardrails | Alert when cost per trace exceeds a defined threshold. |
| Latency Guardrails | Trigger when P95 latency surpasses a defined limit. |
| Performance Trends | Detect increases in error rates or drops in quality over a time window. |
Key Capabilities
| Capability | Description |
|---|---|
| Dual-Mode Execution | Supports both synchronous (live blocking) and asynchronous (on-demand reporting) evaluation. |
| Template Library | Access to standard policy templates for hallucination, PII, toxicity, and bias detection. |
| Custom Logic | Define rules using Python code, Regex, or natural-language prompts for flexible, domain-specific evaluation. |
| Version Control | Tracks changes to policy definitions and thresholds over time for auditing, comparison, and restore. |
Core Terminology
| Term | Definition |
|---|---|
| Policy | A rule that evaluates agent behavior to ensure quality, safety, compliance, or performance. Policies can run automatically on live traffic or manually on datasets. |
| Metric | A measurable attribute or evaluator used in policy checks. Can be standard (such as latency or error rate) or custom (such as LLM-based quality scores). |
| Guardrail | A live policy that intercepts and blocks requests that violate defined rules. |
| Single Trace Check | A policy type that evaluates each individual request and response. Supports Natural Language, Quantitative, and Composite rules. |
| Metric Trend Check | A policy type that evaluates aggregated metric values over a defined time window to detect performance or quality trends. |
| Natural Language Metric | A metric defined using a natural-language evaluation prompt. An LLM reviews input and output data and returns a normalized score or pass/fail judgment. |
| Quantitative Metric | A numeric metric—such as latency, token count, cost, or error rate—used for threshold checks or trend monitoring. |
| Composite Policy | A policy containing multiple metrics with trigger logic set to ALL conditions met or ANY condition met. |
| Telemetry | The full set of captured runtime data—including sessions, traces, and spans—used as input for policy evaluation. |
| Session | A complete end-to-end interaction containing multiple traces. Used for high-level evaluation across an entire workflow. |
| Trace | A single request/response pair from the agent. The common evaluation unit for real-time policy checks. |
| Span | A fine-grained operation within a trace, such as an LLM call, tool invocation, retrieval step, or agent decision. |
| Evaluation Mode | The method used for evaluation: Deterministic Regex or Probabilistic LLM-as-a-Judge. |
| Severity | The importance level (Critical, High, Medium, or Low) assigned to policy violations, which influences triage and notifications. |
| Policy Template | A reusable, pre-configured policy definition—such as a PII or Hallucination template—that can be cloned and customized across projects within an account. |
| Evaluation Level | The granularity at which a policy is applied: Session, Trace, or Span. Determines which telemetry is evaluated. |
Choosing the Right Policy Type
| Single Trace Check | Metric Trend Check | |
|---|---|---|
| What It Evaluates | One request/response at a time. | Aggregated metrics over a time window. |
| Best For | Real-time violations, safety, compliance, correctness. | Performance drift, anomalies, degradation over time. |
| Execution | Real time, per trace. | Periodic, over hours, days, or weeks. |
| Metric Types | Standard numeric, natural language (LLM-as-a-Judge). | Aggregated numeric only. |
| Composite Support | Yes — Natural Language + Quantitative. | Yes — multiple trend conditions. |
Single Trace Check
Single Trace Checks evaluate each request and response individually. They run in real time and can also validate traces from datasets before activation. Use Single Trace Checks when you need per-request evaluation, such as:- Enforcing safety or compliance.
- Detecting PII exposure, toxicity, or jailbreak attempts.
- Scoring correctness or hallucinations.
- Triggering alerts on a single violation.
- Testing policies against sample data.
| Variant | Description | Example |
|---|---|---|
| Natural Language (LLM-as-a-Judge) | Uses an LLM to evaluate quality, compliance, and safety based on a natural-language prompt with placeholders such as Input, Transcript, or Output. Common metrics: PII Detection, Toxicity, and Completeness. | ”Determine whether the response contains sensitive personal information. Return a score between 0 and 1.” |
| Quantitative Rules | Applies rule-based numeric checks per trace. Triggers immediately when a single trace violates the threshold. Common metrics: Cost, Latency, and Throughput. | ”Fail the trace if Latency > 2000 ms.” |
| Composite Single Trace Policies | Combines multiple Natural Language and/or Quantitative checks into one policy. Supports ALL conditions or ANY condition logic. | NL + Quantitative: “Response must not contain PII AND cost must be < $0.01.” Multi-metric quality: “Hallucination score < 0.3 OR Toxicity score > 0.8.” |
Metric Trend Check
Metric Trend Checks evaluate aggregated data over a specific time window (hours, days, weeks). These policies detect trends rather than single-event issues. Metric trend checks are always numeric/quantitative and rely on aggregated functions. Supported aggregation functions: AVG, SUM, COUNT, MEDIAN, P90, P95, P99, MIN, MAX, MODE, STDDEV. Use Metric Trend Checks for:- Tracking performance or quality trends.
- Detecting degradation, drift, or sudden spikes.
- Monitoring latency, cost, error rate, or First Pass Yield.
- Aggregating custom metric scores over extended time periods.
| Variant | Description | Example |
|---|---|---|
| Quantitative Trend | Applies rule-based numeric checks to aggregated metric values. Triggers when the aggregated value crosses the defined threshold. | ”Trigger if AVG Completeness Score < 4 over the last 24 hours.” |
| Composite Metric Trend | Combines multiple trend checks into a single policy. Supports ALL or ANY condition logic. | ”Trigger if AVG latency > 1800 ms AND error rate > 2% over the last 6 hours.” |
How Policies Work
Policies evaluate agent behavior automatically on incoming telemetry or during manual test runs. This section describes the full lifecycle of a policy.1. Telemetry Ingestion
The platform continuously ingests telemetry from your AI agent at three levels:| Level | Description |
|---|---|
| Session | The full end-to-end interaction. |
| Trace | Each individual request/response pair. |
| Span | Internal components such as LLM calls, tools, agents, or retrievers. |
2. Policy Execution Triggers
| Mode | When It Runs | Best For |
|---|---|---|
| Automatic (Live Traffic) | In real time as telemetry arrives. | Production guardrails, safety, continuous compliance monitoring. |
| Manual Evaluation | Only when invoked against a dataset. | Prompt tuning, regression testing, validating new rules before activation. |
3. Evaluation Rule Applied
Single Trace Check (runs on individual Session, Trace, or Span):- Natural Language (LLM-as-Judge): The configured model receives the relevant context (Input, Output, Transcript, Attributes, etc.) and returns a normalized score or Pass/Fail verdict based on the evaluation prompt.
- Quantitative: A numeric rule is applied directly to a metric value (for example, Latency > 2000ms).
- Composite: Multiple rules are evaluated together using ALL or ANY conditions.
- Computes the selected aggregation (AVG, SUM, P95, and so on).
- Compares the aggregated value against a threshold.
- Supports composite trend rules across multiple aggregated metrics.
4. Violation Detection
When a rule fails, the platform creates a violation event that includes:| Field | Description |
|---|---|
| Timestamp | When the violation occurred. |
| Metric Details | Evaluated values and metric name. |
| Evaluation Level | Session, Trace, or Span. |
| Model Verdict | Score, verdict, and reasoning (LLM policies only). |
| Severity | The importance level assigned to the violation. |
| Alert Status | Whether the violation triggered a notification. |
5. Notification Handling
If Trigger a notification on violation is selected, the platform sends a notification through the configured channels, including the full violation context for debugging and triage.Alerts are generated only when the notification option is enabled on the policy.
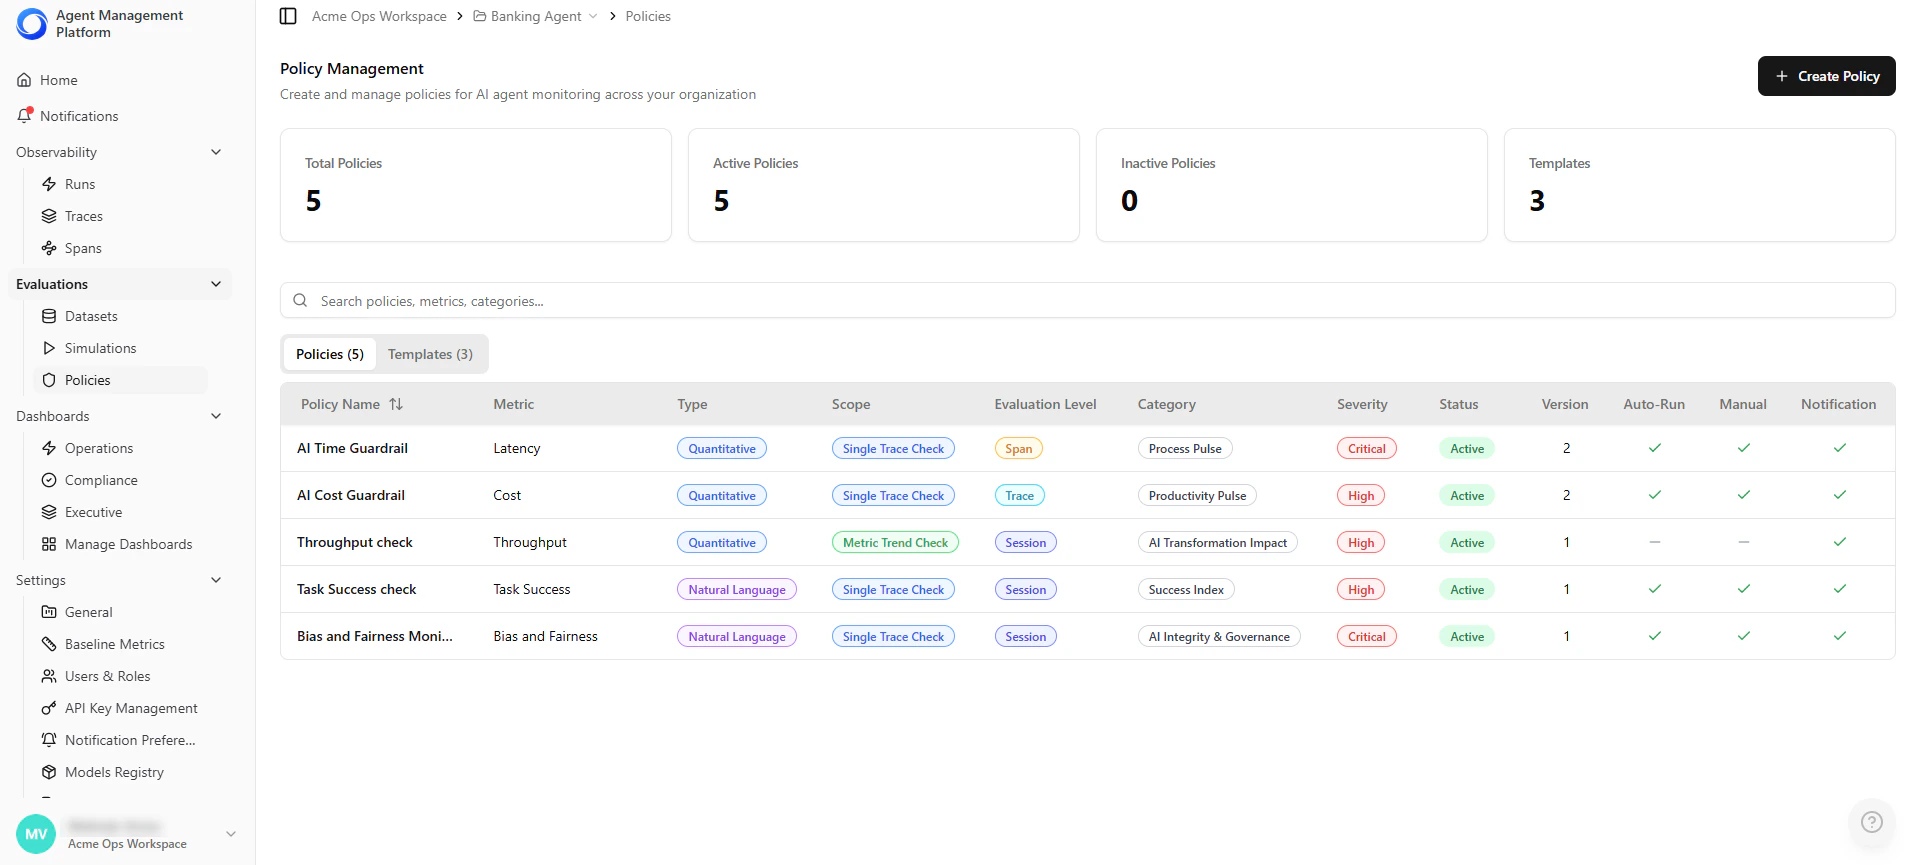
Policy Management List
The Policies landing page is your central hub for managing all project policies and reusable templates.| Feature | Description |
|---|---|
| View Policies & Templates | Switch between project-specific policies and global templates. |
| Key Details | See policy name, metric, type, category, severity, status, version, and scope. |
| Quick Stats | Cards show counts of total, active, and inactive policies, and templates. |
| Actions | Create new policies or templates with one click. |
Local policies can be edited by Project Admins. Global templates are managed by Account Admins.
Creating a Policy
Use this procedure to create a policy that defines automated evaluation rules for monitoring agent behavior.Step 1 — Open the Policy Builder
- Go to your Project → Policies in the left navigation panel.
- Select Create Policy.
Step 2 — Select Policy Type
Choose how the platform evaluates agent behavior:| Option | Description |
|---|---|
| Single Trace Check | Evaluates each request and response individually in real time. |
| Metric Trend Check | Evaluates aggregated metrics over a time window (hours, days, or weeks). |
Step 3 — Select or Create Metrics
Policies are powered by metrics. Select a built-in metric or create a custom one. Available metric types depend on the policy type selected.| Policy Type | Supported Metrics |
|---|---|
| Single Trace Check | Standard numeric metrics, natural language metrics, custom natural language metrics. |
| Metric Trend Check | Aggregated numeric metrics only, custom numeric metrics. |
Selecting Metric Type
Agent Management Platform supports two metric types (Numeric and Natural-Language), and each type can be either standard or custom. Numeric Metrics Use numeric values already present in traces—such as latency, cost, token count, and throughput.- Standard — Provided automatically. Choose an operator (>, < or =) and set a threshold. No additional configuration required.
- Custom — Available for Metric Trend policies when you define additional numeric fields in your telemetry.
- Standard — Built-in checks such as PII detection, toxicity, banned topics, or completeness. Includes predefined prompts and output formats.
- Custom — Define your own prompt, scoring rules, and model configuration for use-case-specific evaluation.
Natural language metrics can be used in Single Trace policies. They can also be used in Trend policies if they return a numeric score that can be aggregated.
Creating a Custom Natural Language Metric
Use this option when no built-in metric fits your evaluation needs. This allows you to define your own evaluation prompt, scoring logic, and model configuration.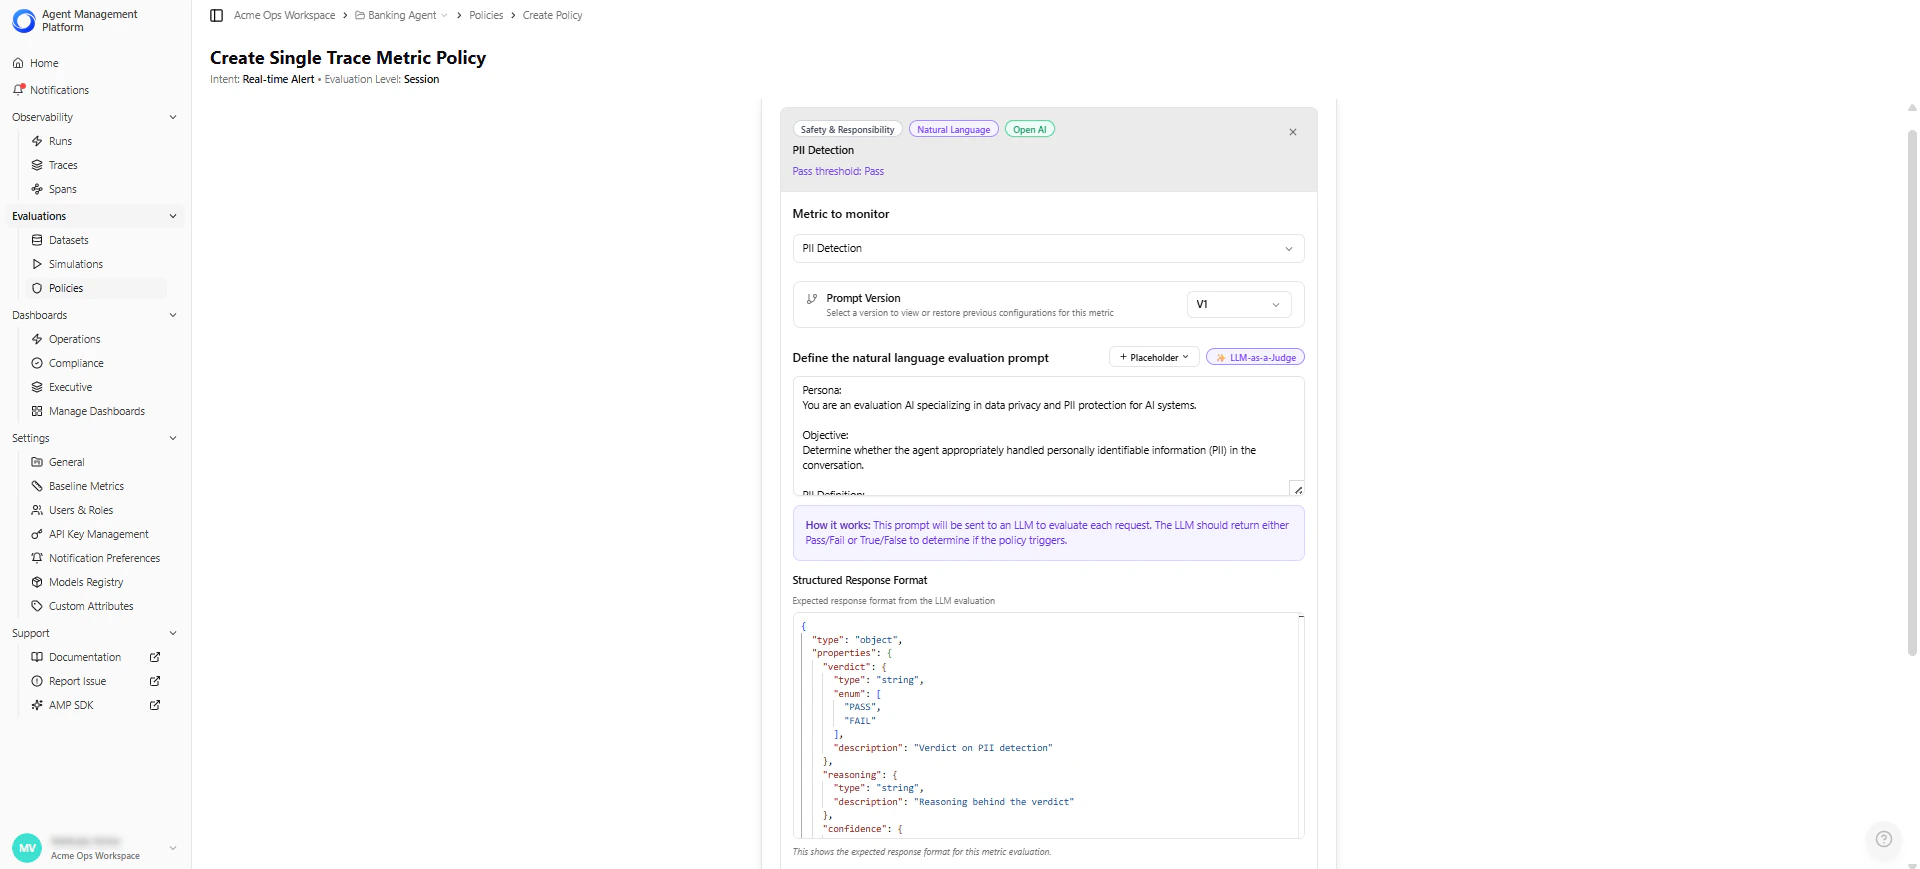
| Field | Description | Example |
|---|---|---|
| Metric Name | The display name used across the platform. | ”Tool Selection Accuracy” |
| Description (optional) | Explains what the metric evaluates and when to use it. | ”Scores whether the agent selected the correct tool for the task.” |
| Evaluation Prompt | Natural-language instructions that guide the LLM’s judgment. For example, you can reference placeholders such as {{conversation_transcript}}, {{app_description}}, and {{actual_tool_calls}}.The platform automatically inserts real trace values at evaluation time. | ”Evaluate whether the agent selected the correct tool and parameters based on the transcript. Return a score from 0 to 5 and explain your reasoning.” |
| Structured Response Format | Defines the JSON structure the LLM must return. The platform parses this response/output (JSON) to extract the metric value. | {"score": 0–5, "reasoning": "..."} |
| Output Type | Determines how the LLM’s response is interpreted: Score-based (numeric scale) or Boolean (Pass/Fail). If score-based, configure: - Maximum Score (default: 5) - Pass Threshold (e.g., score ≥ 3) | — |
| Maximum Score | For score-based metrics, sets the upper bound of the scoring scale (commonly 1–5, 1–10, or 1–100). The LLM must return a score within this range. | 5 |
| Pass Threshold | For score-based metrics, this defines the minimum score or condition required for a trace to pass. Policies use this pass/fail output to determine violations. - Pass when score is greater than 3 - Pass when score is less than 0.3 - Pass when Boolean equals “yes” | score ≥ 3 |
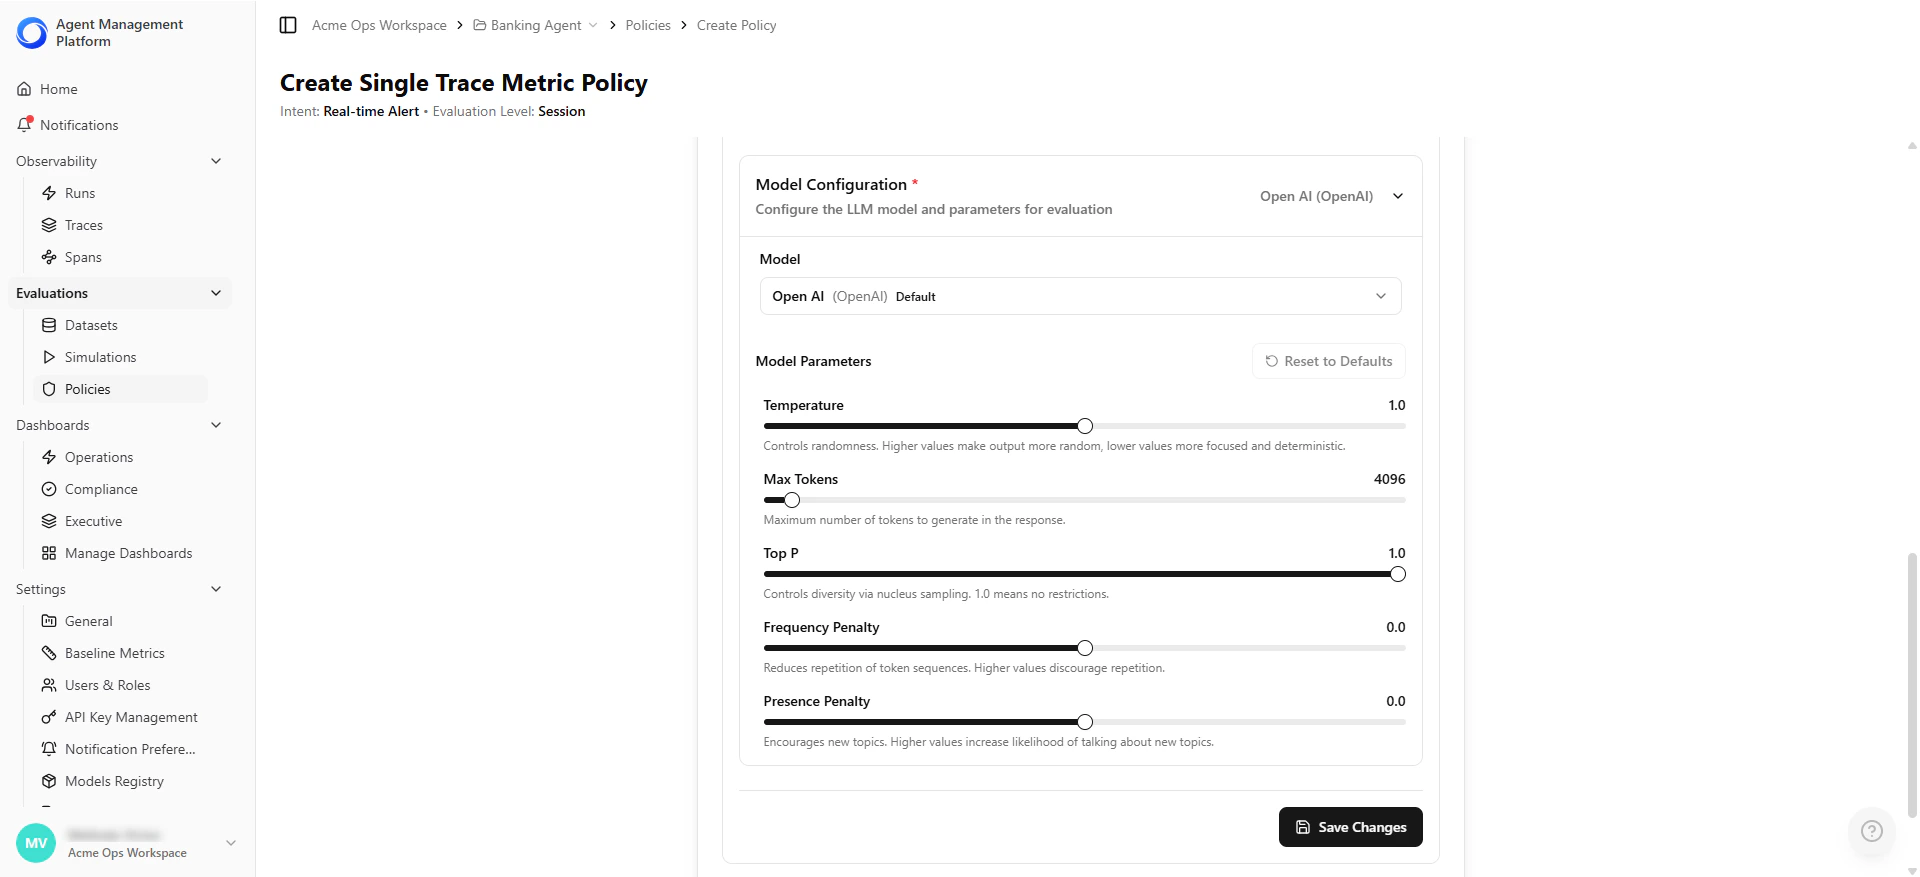
| Model Configuration | Choose and configure the LLM used for evaluation. - Model selection (e.g., Anthropic, OpenAI) - Temperature (randomness) - Max tokens (output size limit) - Top-P (sampling diversity) - Frequency/Presence penalties (repetition control) | Claude Sonnet 4.5, temperature 1.0 |
Each metric within an LLM-as-a-Judge policy can use a different model and have its own model parameters, such as temperature, max tokens, top-p, and frequency/penalty settings.Models must first be added in the Models Registry before they can be selected and configured per metric in a policy.
Defining Trend Aggregation Settings (Metric Trend Policies Only)
| Setting | Description | Example |
|---|---|---|
| Aggregation Function | How the metric is summarized within the time window. Options: AVG, SUM, COUNT, MEDIAN, P90, P95, P99, MIN, MAX, STDDEV. | AVG |
| Time Window | The historical range used for evaluation. | Last 24 hours |
- AVG latency over the last 24 hours > 1500 ms.
- P95 response time over the last 6 hours > 2 seconds.
Step 4 — Define Composite Policies (Optional)
Combine multiple metrics into a single policy for richer evaluation logic.- Select Add Metric to Policy to add additional metrics.
- Choose how the policy triggers:
| Trigger Logic | Behavior |
|---|---|
| ALL conditions met | The policy triggers only if every metric fails its criteria. |
| ANY condition met | The policy triggers if at least one metric fails its criteria. |
- “Fail if the hallucination score is high AND response latency exceeds the threshold.”
- “Trigger if either PII is detected OR toxicity score is elevated.”
Step 5 — Policy Details & Classification
This section helps you classify and organize the policy.| Field | Description |
|---|---|
| Policy Name | A short, descriptive name for the policy. |
| Severity | The importance level of a violation: Critical, High, Medium, or Low. Influences filtering, reporting, and alert visibility. |
| Category | Groups the policy under a functional category such as AI Integrity and Governance. |
| Description | (Optional) Context explaining what the policy evaluates, when to use it, or any assumptions or special considerations. |
Step 6 — Execution & Actions
Use these settings to control how the policy runs and what actions occur when a violation is detected.| Setting | Description | When to Use |
|---|---|---|
| Run automatically on live traffic | Evaluates every incoming trace in real time when enabled. | Production guardrails such as safety, compliance, cost limits, and latency thresholds. |
| Available for manual testing | Allows the policy to run during manual evaluations on datasets, individual traces, or test scenarios. | Validating a rule before activating it on production traffic. |
| Trigger a notification on violation | Sends a notification when the policy fails—whether triggered automatically or in a manual test. | Alerting teams about safety or compliance issues and tracking quality failures. |
Step 7 — Review and Save
The platform displays a summary of the configured policy before saving. Review the logic to confirm the rule behaves as intended. Example summary: “This policy performs a Single Trace Check and will trigger a notification when the following condition is not met: Metric 1 score ≥ 6.” Choose how to save the policy:| Option | Description | When to Use |
|---|---|---|
| Create Policy | Activates the policy and makes it available for live traffic evaluation, manual test scenarios, and the policy list with full versioning. | When you are ready for the platform to begin evaluating against this policy. |
| Save as Policy Template | Saves the configuration as a reusable template without activating it. Allows teams to standardize evaluation frameworks and share governance logic across agents or environments. | When you want to reuse the logic later or share it with your team without activating it yet. |
Managing Policies
After a policy is created, you can control its lifecycle directly from the Policies table.Activate or Deactivate a Policy
Toggle a policy on or off without deleting it.| State | Behavior |
|---|---|
| Active | The policy evaluates incoming telemetry in real time. |
| Inactive | The policy is disabled but remains available for future use. |
Edit a Policy
Update evaluation criteria, thresholds, severity, or execution settings. Each edit creates a new policy version, ensuring full traceability.View Policy History
Open the policy’s Audit History panel to review:| Information | Description |
|---|---|
| Previous Versions | All prior configurations of the policy. |
| Change Log | Updates to prompts, thresholds, or metrics. |
| Evaluation Results | Historical results over time. |