

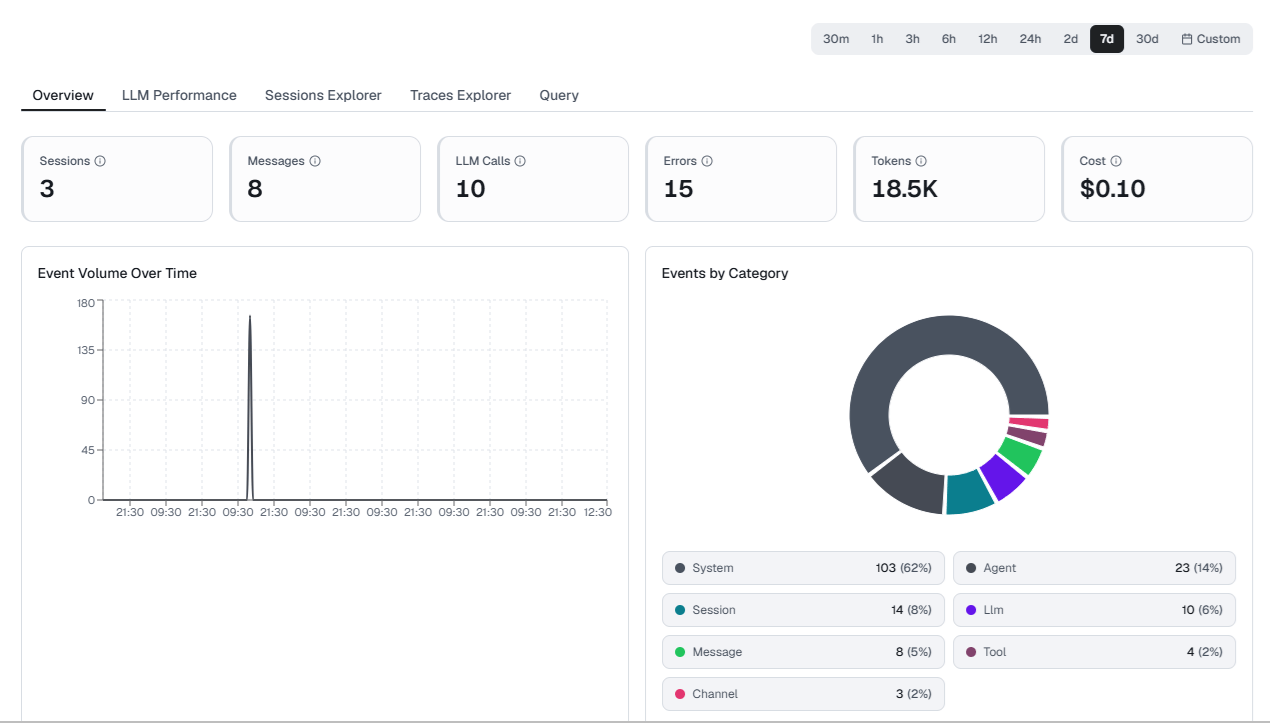
Overview
Six metric cards summarize the selected period at a glance.LLM performance
Model-level metrics, including per-call latency distributions, average tokens per call, error rates by model, and throughput. Use this view to benchmark model performance and identify candidates for optimization or replacement.The LLM Performance tab isn’t captured in the current screenshots. Confirm its metric cards and charts before publishing.
Sessions explorer
Sessions Explorer lists every session in the selected period so you can isolate the ones worth investigating. Four metric cards summarize the set.Narrow the list
Status chips filter the list to All, Active, Completed, Escalated, Failed, or Ended. Below the chips, five controls refine the results further.
Select Columns to choose which columns the table displays. Select Export to download the session list.
Session list
Expand a row to see the full session ID, channel, trace event count, and last activity. Select View Traces to open that session in Traces Explorer.
Traces explorer
Traces Explorer inspects the individual events inside a session. Two sub-tabs divide the view: Traces for all execution events, and Generations for model generations.Filter traces
Type chips filter events to All, LLM Call, Tool Call, Decision, Handoff, Error, or Agent. Each applied filter appears as a chip below the search field, for exampleType: LLM Call. Remove a single filter from its chip, or select Clear all to remove them all. Reset filter shows the number of active filters and restores the unfiltered list.
Use Search traces to match events by keyword, Filters for additional filter options, and Export to download the trace list.
Sessions panel
The left panel lists the sessions in scope. Each card shows the agent name, status, span count, turn count, and duration. Select a session to load its events in the detail panel.Timeline and waterfall
The detail panel shows the selected session’s events in one of two views. A counter reports how many events the current filter matches, for example4 of 84 events.
Waterfall opens with a summary bar reporting the trace mode (for example, Historical), Spans, Duration, Tokens, Cost, and Errors. Each span row shows a status icon for success or failure, the agent and model, the offset from session start, and the duration bar. Chips on the row repeat the span duration, token count, and cost.
Event detail
Every event card carries the event type, agent name, and duration, plusphase, run, and cause badges. Expand a card for the full record.
Each identifier has a copy control.
An LLM Call event adds model execution detail: Model, Provider, Input Tokens, Output Tokens, Total Tokens, Cost, and Streaming. Expand Messages to read the prompt and user turns, and Response to read the model output.
A Tool Call event shows the Tool name, an expandable Input, and Show raw data for the unformatted payload.
Query
The Query tab runs SQL against project event data for investigations the pre-built views don’t cover.- Select a table, for example
abl_platform.platform_events. - Write your SQL, or select Example Queries to start from a template.
- Select Execute. Select Clear to empty the editor.
{tenantId:String} and {projectId:String} for tenant and project isolation, and {from:DateTime64(3)} and {to:DateTime64(3)} to follow the selected time range. {sessionId:String} is optional. Results are capped at 1,000 rows.
The following query counts events by type and flags errors:
Results — 20 rows (11ms). Select Copy to copy the result set, or Add to dashboard to save the query as a widget on a custom dashboard.