

View the Summary Dashboard
-
Click Analytics on the left navigation pane. The Analytics panel displays the list of reports.
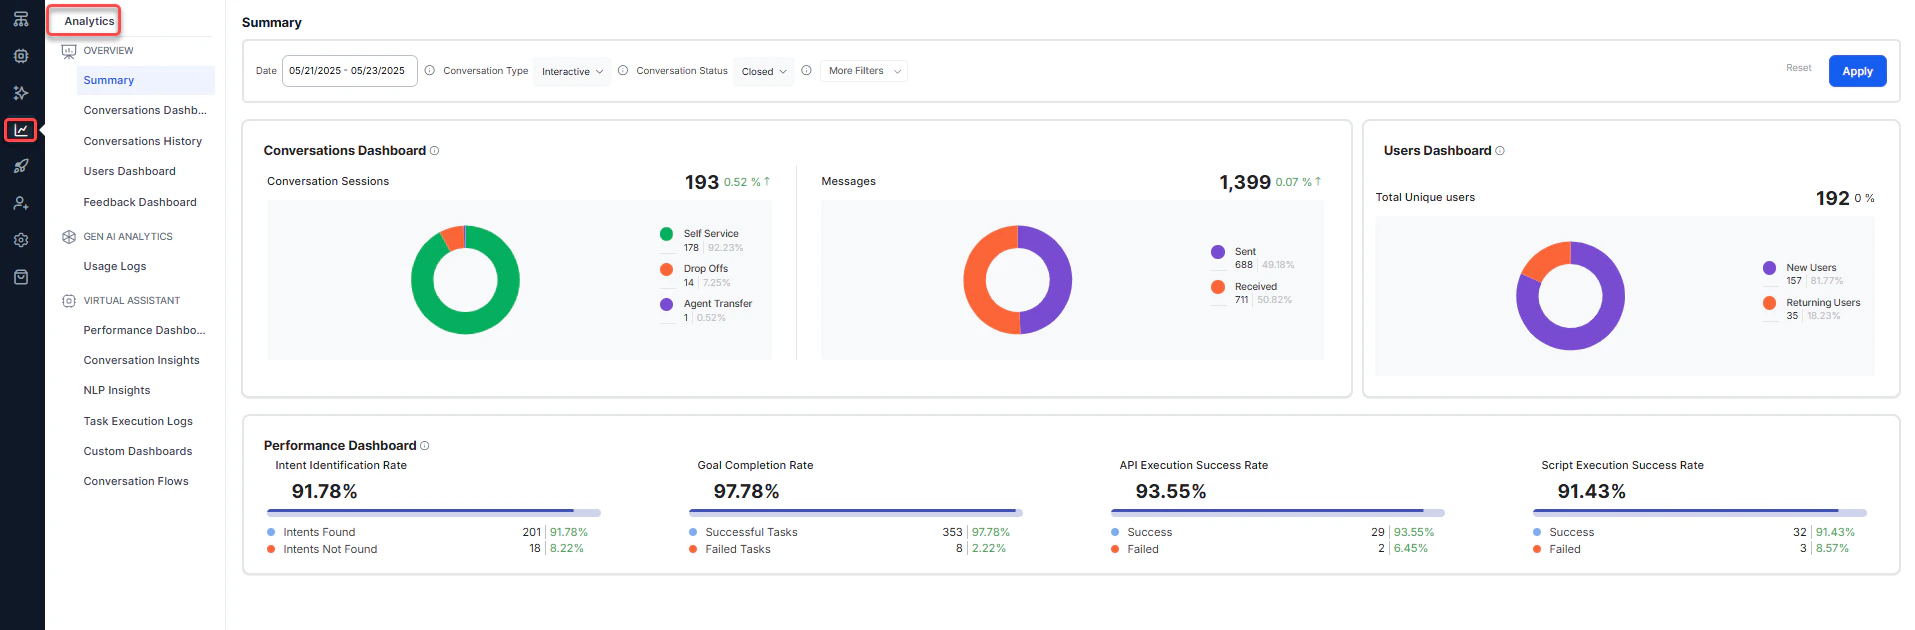
- Click Summary under the Overview section of the Analytics panel. The Summary Dashboard appears on the right side of the page.
- Select the appropriate filters and click Apply.
Summary Dashboard Components
Once users start interacting with your assistant, the following sections appear on the Summary Dashboard.- Conversations Dashboard: Displays key AI Agent metrics and insights into conversation usage and containment. Shows the conversation trend broken down by self-service, drop-off, and agent transfers. Learn more.
- Users Dashboard: Displays trend-based analytics on new and returning users. Learn more.
- Performance Dashboard: Provides insights on NLP and execution performance, including intent identification rate, goal completion rate, and service and script execution rates. Learn more.