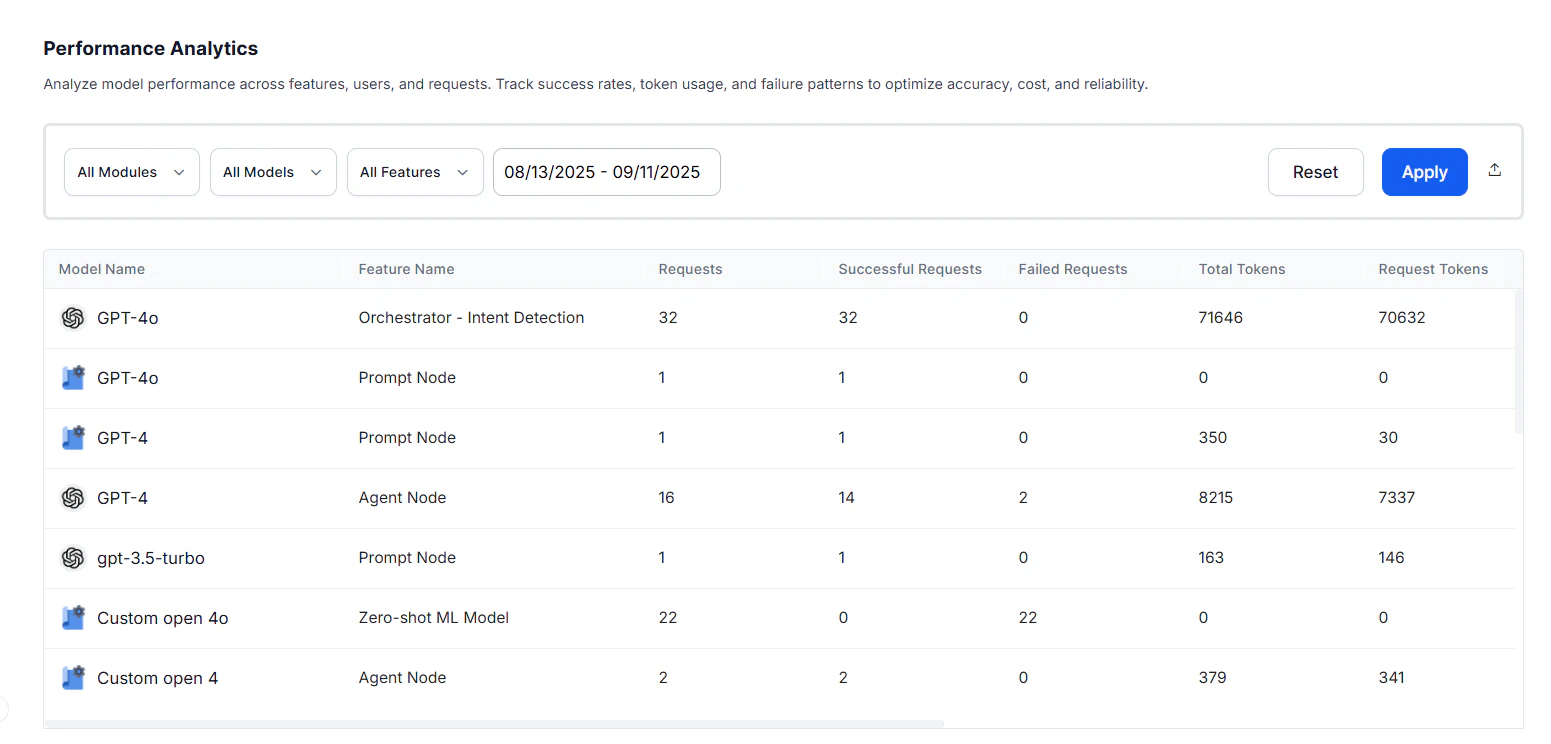
| Model | The Large Language Model to which the request was made. |
| Feature | The platform feature making calls to the LLM models. |
| Requests | Total number of LLM calls made for that model-feature combination. |
| Successful Requests | Number of LLM calls that executed without errors. |
| Failed Requests | Number of LLM calls that encountered errors. Together with successful requests, provides an execution breakdown to monitor system reliability. |
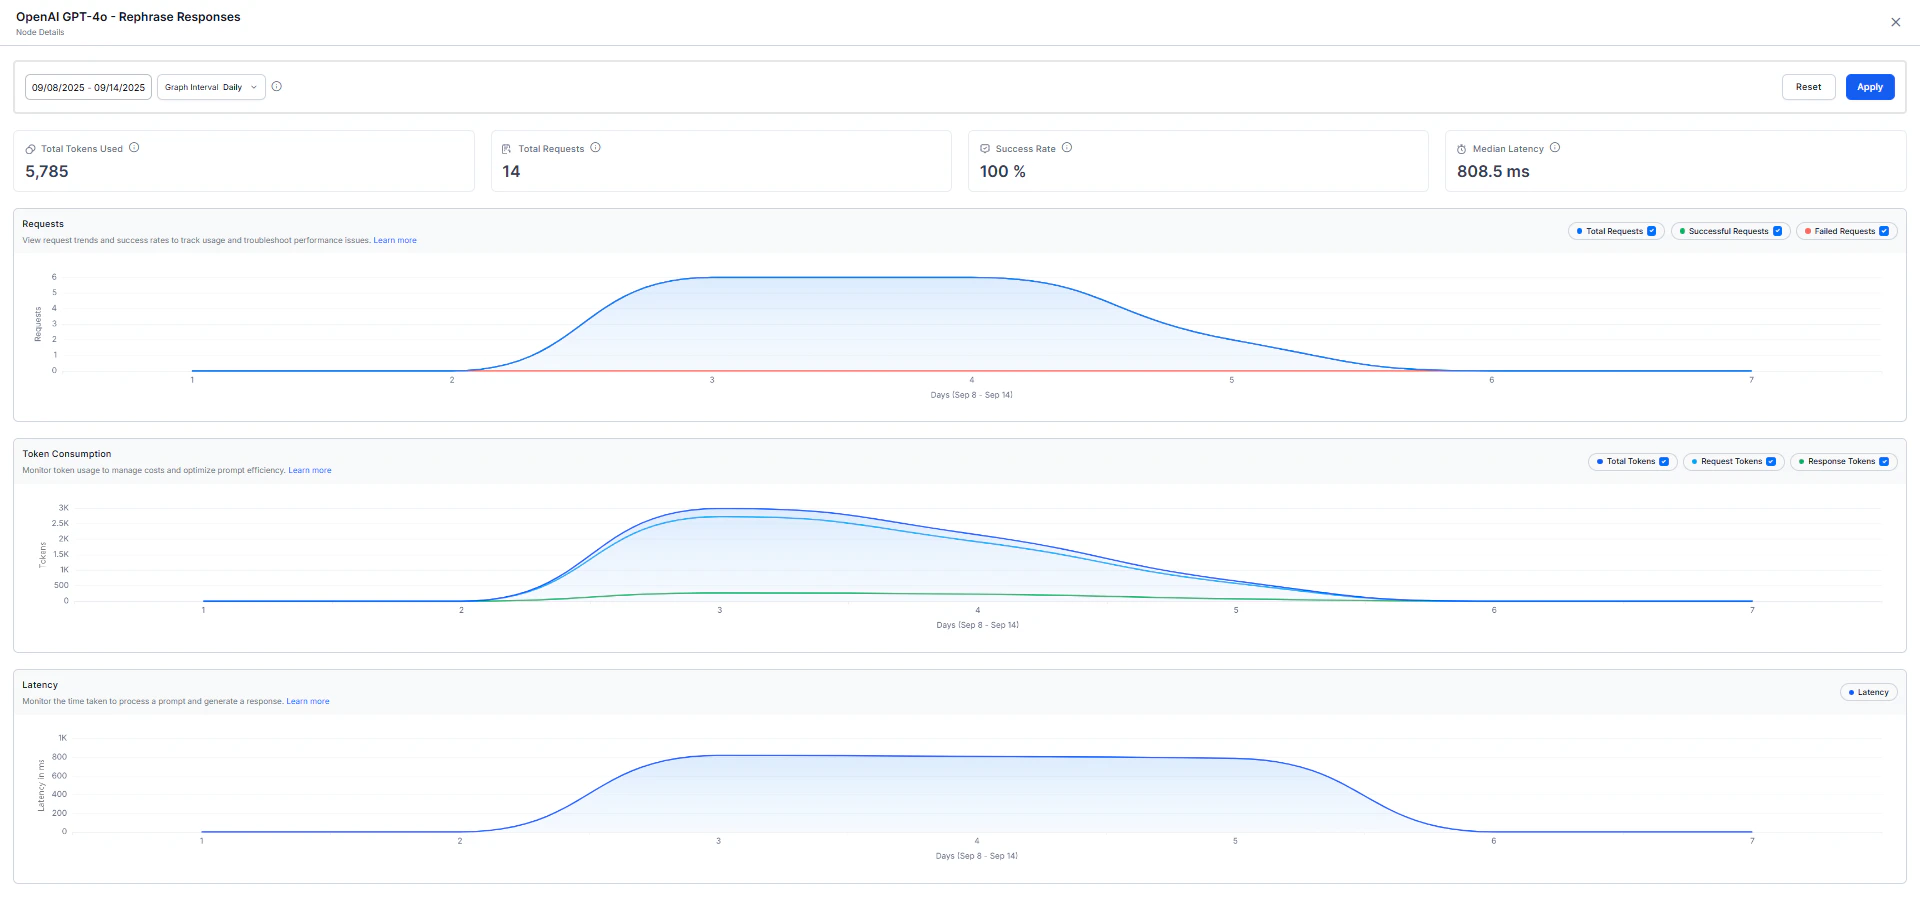
| Total Tokens | Combined token count for request and response. |
| Request Tokens | The individual parts of input text (words, punctuation) given to the model to create a response. These tokens form the basis for the model’s understanding. |
| Response Tokens | The pieces of generated output (words, punctuation) showing the model’s response. These tokens form the structured output of the model. |
| Avg. Tokens per Request | Average token consumption for each request. |
| Avg. Tokens per Response | Average token consumption for each response. |
| Average Response Time | The mean time taken by the model to return a response. |
| Median Latency | Median processing time, useful for understanding response consistency. |