The Model Analytics Dashboard provides aggregate performance metrics for all model types in your account. Model Traces provides run-level analysis for each model request, including inputs, outputs, and metadata. Use the dashboard for trend analysis and Model Traces for troubleshooting individual runs.
Model Analytics Dashboard
The Model Analytics Dashboard tracks performance for fine-tuned, open-source, and external models in your account. It measures:
- Model latency and response times.
- Request success and failure rates.
- Model scaling patterns and usage.
- Credit consumption for deployments and fine-tuning.
Access the Dashboard
-
In the AI for Process top menu, click Settings.
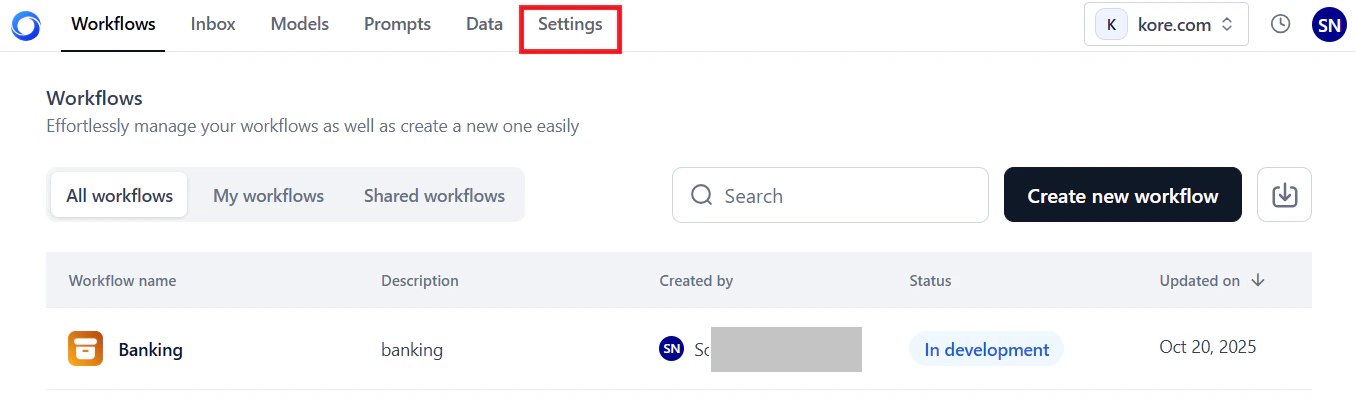
-
On the left menu, select Monitoring > Analytics.
-
Click the Model Analytics tab.
The dashboard loads with data for the last 7 days by default. Click the Refresh icon to load the latest data.

Key Metrics
The dashboard displays account-level and model-specific metrics.
Account-Level Metrics
These metrics summarize credit usage and model counts across your account for the selected period.
| Metric | Description |
|---|
| Credits consumed in deployment | Credits deducted from your account for deploying models. |
| Credits consumed in fine-tuning | Credits deducted from your account for fine-tuning models. |
| Number of Deployed Models | Total models deployed in your account. |
| Number of Fine-tuned Models | Total models fine-tuned in your account. |
Hover over the i icon to view a summary for each metric.

Model-Specific Metrics
Available metrics vary by model type.
| Metric | Fine-tuned and Open-source | External |
|---|
| Model Latency | Per-request latency for a 24-hour or 7-day period. For longer ranges, average daily latency is shown. See Model Latency. | Same as fine-tuned and open-source. |
| Requests | Success and failure trends, total requests, and average credits per request. See Requests. | Same, but without average credits per request. |
| Model Scaling and Usage | Replica count and hardware configuration during deployment. See Model Scaling and Usage. | Not available. |
| Tokens | Not available. | Input and output token bar chart for the selected period. See Tokens. |
Filter Dashboard Data
Combine Global Timeline Filters and Model Performance Filters to generate targeted analytics.
Global Timeline Filters
The filter options are identical to those on the Workflows Analytics Dashboard. See Global Timeline Filters for available options and usage.
These filters apply only to model-specific metrics and work alongside a global timeline selection. Available filters depend on the selected model type.
If multiple deployments exist for the same model name, they are listed with their respective deployment timestamps.
-
Select Model (Model Name): Select the deployed model.
-
Select Deployment: Select the model’s deployment name.
-
Select Filter (version): Select the deployment version.
- If no versions exist for a model, the dropdown is empty.
- By default, data for all model versions is shown unless you select a specific version.

External models
-
Select Model (Model Name): Select the deployed model.
-
Select Connection: Select the third-party service connection name.

To load data in the widgets:
- Select a date or date range using the Global Timeline Filters.
- Select the model type tab: Fine-tuned, Open-source, or External.
- Select the model name, and optionally the deployment name and version (fine-tuned or open-source) or the connection name (external models).
The widgets update automatically. A single-day selection shows hourly data; a date range shows daily data.
- Widgets show data only for periods the model was deployed. For example, if a model was active for 4 days and undeployed for 3 days in a 7-day view, only the 4 active days appear.
- The graph shows curves only when requests are processed. No data points appear for hours or days with no activity.
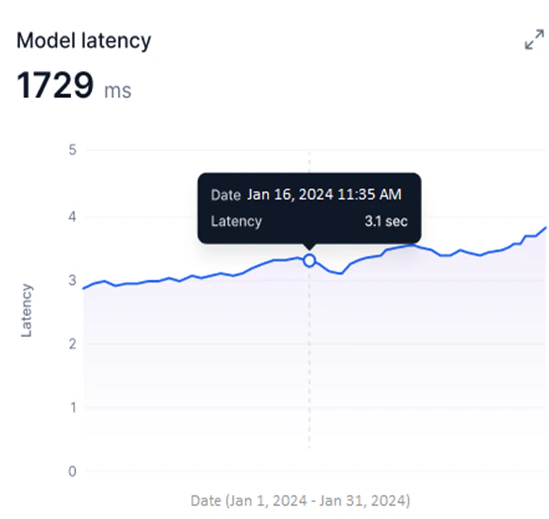
Model Latency
Available for Fine-tuned, Open-source, and External models. This widget shows a line graph of the selected model version’s latency during the selected period.
- Y-axis: Latency in milliseconds (auto-scaled).
- X-axis: Date.
- A blue line shows per-request latency for 24-hour or 7-day periods. For longer date ranges, the graph shows average daily latency.
Hover over a data point to view the latency for a specific request (24-hour or 7-day periods) or the average latency for a specific date and time (longer ranges).
 Use this widget to:
- Identify peak usage and low-efficiency periods by tracking latency over time.
- Detect sudden latency spikes that indicate performance issues.
- Compare deployed model versions to identify the best-performing option.
- Correlate latency trends with credit usage for resource optimization.
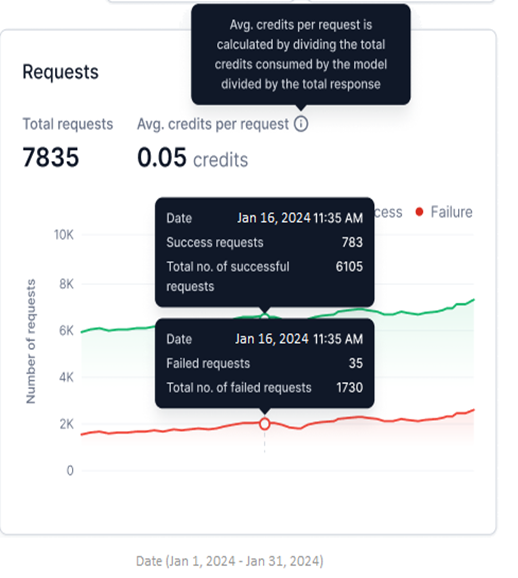
Requests
Available for Fine-tuned, Open-source, and External models. This widget shows successful and failed requests as two line graphs for the selected period.
- Y-axis: Number of Requests (auto-scaled).
- X-axis: Date.
- Successful requests appear in green; failed requests in red.
- Total Requests: Combined count of successful and failed requests for the selected period.
- Avg. credits per request: Total credits consumed divided by total responses generated.
Avg. credits per request is not shown for external models.
 Use this widget to:
- Monitor success versus failure rates and identify failure patterns.
- Detect sudden spikes in failures using the hourly view.
- Compare request performance across model versions.
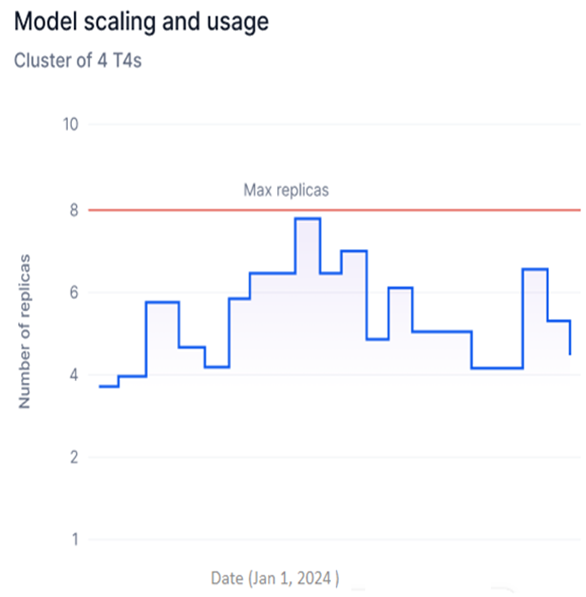
Model Scaling and Usage
Available for Fine-tuned and Open-source models only. This widget shows a step graph of the number of replicas with a specific hardware configuration deployed for the selected model version.
- Y-axis: Number of Replicas (adjusts based on deployed replicas).
- X-axis: Date.
- Each upward step represents additional replicas being generated; each downward step represents replicas being undeployed.
Multiple Hardware is shown when replicas with more than one hardware configuration are deployed across a date range.
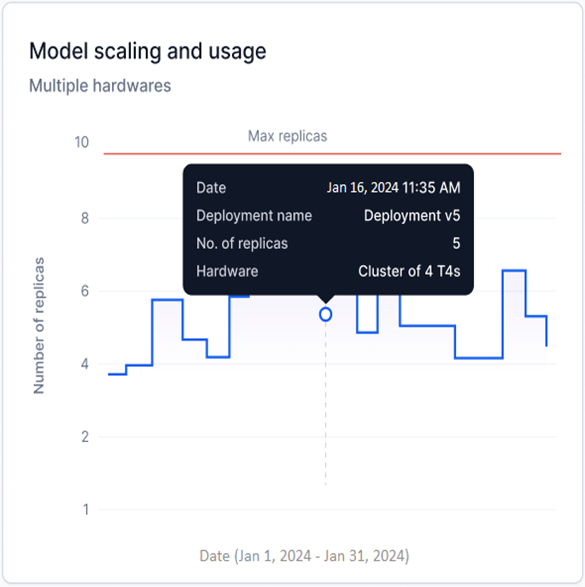 Maximum replicas limit
For a single-day selection, a red line indicates the maximum number of replicas configured during model deployment.
Maximum replicas limit
For a single-day selection, a red line indicates the maximum number of replicas configured during model deployment.
 Use this widget to:
- Track replica deployments over time to identify usage spikes and optimize hardware consumption.
- Spot inefficiencies in replica usage and reduce unnecessary deployment costs.
- Monitor scaling against your account’s replica limits to stay within subscription thresholds.
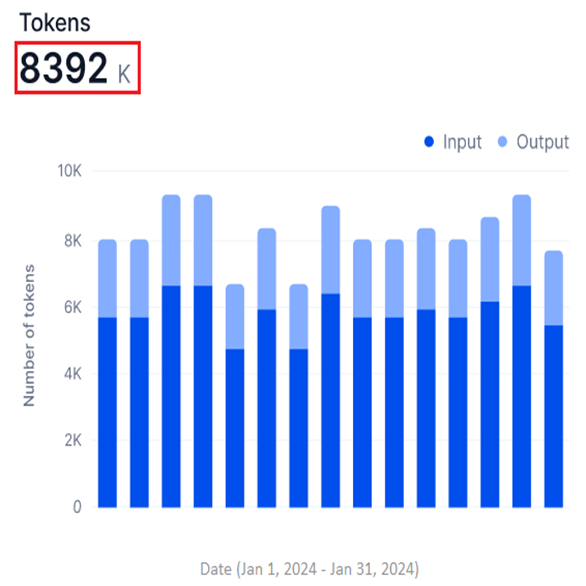
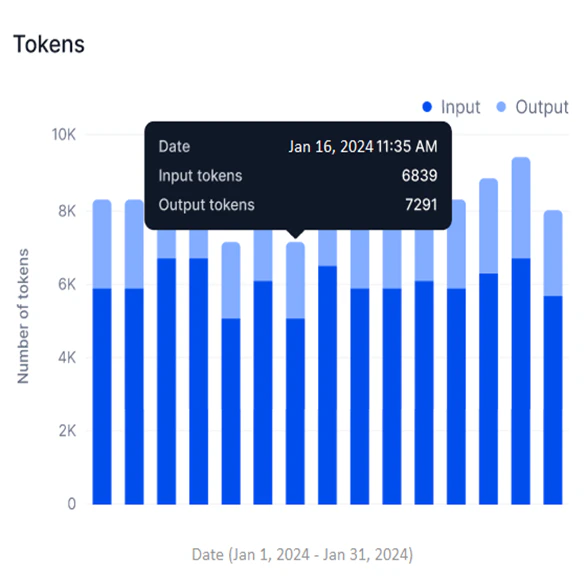
Tokens
Available for External models only. This widget shows a stacked bar graph of input and output tokens for the selected period.
- Y-axis: Number of Tokens (in thousands, K; auto-scaled).
- X-axis: Date.
- Input and output tokens appear in two shades in a stacked bar, showing them as parts of the total tokens used.
- The widget shows the total sum of input and output tokens.
 Hover over a data point to view the timestamp and input and output token counts at that point.
 Use this widget to:
- Assess model efficiency by comparing input versus output token counts.
- Track token-based credit consumption and optimize usage.
- Identify processing bottlenecks and usage patterns over time.
Expand any widget for a drill-down view with its own Global Timeline and Model Performance filters.
- Filter changes in the expanded view don’t affect the main dashboard or global filters.
- Hover over data points to view widget analytics.
 Model Latency
 Requests
 Model Scaling and Usage
 Tokens

Model Traces
Model Traces provides run-level analysis of any model deployed or integrated in your account. Use it to review request inputs, generated outputs, response times, and run metadata. It supports filtering, searching, and exporting data for troubleshooting and performance investigation.
Access Model Traces
-
In the AI for Process top menu, click Settings.
-
On the left menu, select Monitoring > Model Traces.
-
If this is your first visit, select a model from the dropdown menu.

The feature loads with data for the last 30 days by default. On return visits, it preloads data from your previous model selection for the same 30-day default.

Select a Model and Time Period
Model Traces displays data across all deployments for the selected model. For open-source and fine-tuned models, you can filter by deployment name. For external models, data is shown by connection name.
Model Name filter
Select the model to monitor using the Model Name filter:
-
For open-source and fine-tuned models, select from available deployment names, including version options.

-
For commercial models, select the default connection linked to the model.

Time-based filter
Use the time selection filter to scope data to a specific period for targeted analysis or debugging.
- Last 30 Days is the default selection.
- Data appears only if the model processed requests during the selected period.
| Time period | Description |
|---|
| All Time | All runs since the account was created. |
| Today | Data for the current day. |
| Yesterday | Data for the previous day. |
| This Week | Data for all days in the current week. |
| This Month | Data for all days in the current month. |
| Last Month | Data for all days in the previous month. |
| Last 30 Days | Data for the past 30 days from today (default). |
| Last 90 Days | Data for the past 90 days from today. |
| This Year | Data for all days in the current year. |
| Last Year | Data for all days in the previous year. |
-
Click the time selection button (shows Last 30 Days by default).

-
Select a period from the left panel, or select a specific date on the calendar widget.
-
Click Apply.

The selected date range is shown at the bottom of the calendar widget. Navigate months using the forward and backward arrows, or select a specific month or year from the dropdown lists.

 To set a custom date range, click a start date on the calendar. The current day is set as the end date by default.
 The metrics summary at the top of the page shows key performance data for the selected model and period.
| Metric | Description |
|---|
| Total Requests | Total runs serviced by the model since deployment. Reflects processing speed and efficiency. |
| Response Time | P90 and P99 thresholds — the response times below which 90% and 99% of requests fall. Lower values indicate consistent speed; higher values indicate potential issues. |
| Failure Rate | Percentage of requests that failed out of total requests. For example, 5 failed out of 100 equals a 5% failure rate. |
| Hosting Credits | Credits consumed by the deployed model based on usage, for comparison against actual utilization. |
Hosting Credits apply only to AI for Process open-source and fine-tuned models. This metric is not shown for external models.

Model Traces Table
The table displays all runs for the selected model, sorted from the latest to the oldest execution date. It includes data from the first execution onward — whether from deployment (open-source and fine-tuned models) or integration (external models).
Successful requests are marked with a green check icon; failed requests with a red alert icon.

| Column | Description |
|---|
| Status | Success or failure icon for the run. |
| Request ID | Unique identifier for the run record. |
| Response Time | Time taken by the model to respond. |
| Deployment Version | Model version deployed in your account. |
| Source Type | Type of source that initiated the request. |
| Source | Specific source name that sent the request. |
| Executed on | Run execution timestamp. Click the Sort icon to reorder records by ascending or descending date. |
| Input | Input text provided for the run. |
| Output | Output text or response generated by the model. |
 To view the detailed trace for a run, click its row in the table.

Customize the Table View
Use the Visibility Filter to add or remove columns. Toggle a column on to show it and off to hide it.


- All columns are visible by default.
- You can adjust visibility for 8 columns for open-source and fine-tuned models, and 7 columns for other model types.
- The Deployment Type filter is available only for open-source and fine-tuned models.
Search Records
Enter a Request ID or a string value in the Search field to locate specific runs.

Filter by Column
Apply column filters to narrow down the records displayed. Combine multiple columns using AND/OR operators.
Add a filter
-
Navigate to Model Traces and click the Filter icon.
-
Click + Add Filter.

-
In the Filter By window, select values from the Select Column, Operator, and Value dropdown lists. For some columns, enter the value manually.

-
Click Apply.

The table displays matching records. The number of active filters appears on the Filter icon.
 To clear all filters, click Clear All.
 The following table summarizes available filter columns, supported operators, and values.
| Column | Description | Operators | Input Type | Value |
|---|
| Status | Run status | Is Equals To, Is Not Equals To | List | Failed, Success |
| Request ID | Unique run identifier | Is Equals To, Is Not Equals To, Contains | Enter manually | Any value |
| Response Time | Model response time for the request | Is Equals To, Is Not Equals To, Is Greater Than, Is Less Than, Is Greater Than Equals To, Is Less Than Equals To | Enter manually | m:s:ms (minutes:seconds:milliseconds) |
| Deployment Version | Model version deployed for the run | Is Equals To, Is Not Equals To, Contains | Enter manually | Any value |
| Source Type | Source type that sent the request | Is Equals To, Is Not Equals To, Contains | List | Workflow, Prompts, API Key |
| Source | Specific request origin | Is Equals To, Is Not Equals To, Contains | List | Custom user-defined values |
- AND and OR operators cannot be combined in a single filter configuration. Choose one operator and apply it consistently across all filter steps.
- AND: All conditions must be met for a record to appear.
- OR: Any condition being met includes the record.
- To remove a filter step, click the Delete icon.
 To add multiple filters:
-
Follow steps 1–2 from Add a filter above.
-
In the Filter By window, select the AND or OR operator tab.

-
Follow steps 3–4 from Add a filter above.
Export Data
Click Export to generate a CSV file of model traces records based on the selected date range and filters. All eight table columns are included regardless of current visibility filter settings.
 The UI shows export progress while the file is being prepared.
 Once downloaded, a confirmation message appears.
 If an error occurs, an error notification is displayed.
 The file is saved automatically using the format
 modelname_traces_data — for example, GPT4_traces_data.

- Each user’s export runs independently. One user’s cancellation or adjustment doesn’t affect another user’s export.
- Users can cancel an ongoing export operation.
Trace Details
Click a run record in the table to open the Traces window, which shows the Request ID and the following panels.
- Input: The request text provided to the model using input tokens.
- Output: The text output or response generated by the model using output tokens.
Plain text is the default display format. Enable JSON mode to view the complete request or response payload in the code editor, including additional keys not visible in plain text.
In the JSON code editor, the model name shown includes the deployment version for open-source and fine-tuned models, and the connection name for external models.
 The text and JSON code in the editor are read-only. Click the Copy icon to copy content to your clipboard.
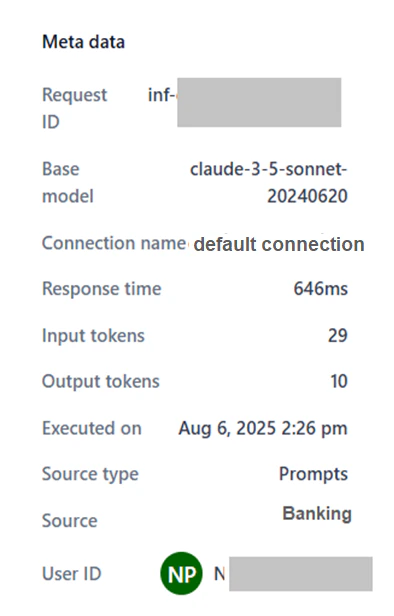
 The metadata panel shows run-specific information to support performance analysis.
Fine-tuned and Open-source models
The metadata panel shows run-specific information to support performance analysis.
Fine-tuned and Open-source models
| Field | Description |
|---|
| Request ID | Unique identifier for the request. |
| Base model | The platform-hosted or imported model that handled the request. |
| Deployment name | The deployment name of the model. |
| Deployment version | Version deployed for the run. |
| Response time | Time taken to generate a response. |
| Input tokens | Token count in the request input. |
| Output tokens | Token count in the model’s response. |
| Executed on | Date and time of the run. |
| Source type | Type of source that sent the request. |
| Source | Specific origin of the request. |
| User ID | Identifier of the user who initiated the request. |
 External models
Includes all fields above (excluding Deployment name and Deployment version), plus:
External models
Includes all fields above (excluding Deployment name and Deployment version), plus:
- Connection name: The deployed connection name for the model.